
MindSphere Web Components
总表
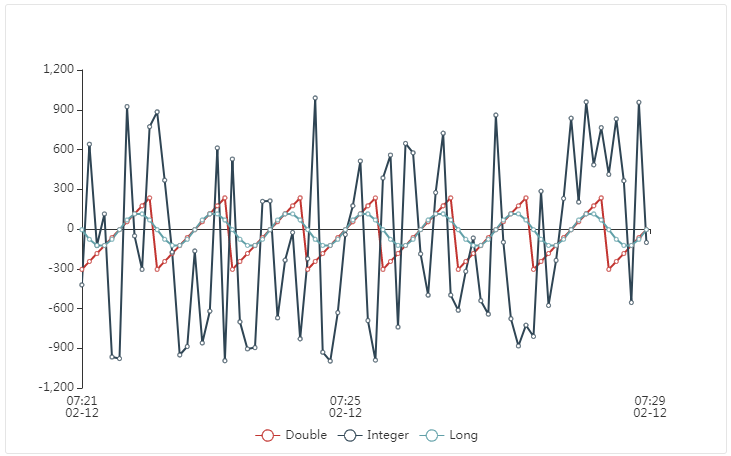
总表显示在特定日期/时间范围内所选 aspect 的 variables 的聚合时间序列数据的线图。基于组件的配置(例如 zoomDisabled和wheelZoom),用户可以通过拖动或缩放来交互式地改变选定的范围。
对于每个聚合,图表按时间戳排序显示第一个值、最后一个值、最小值和最大值,并按每个 variable 用一行连接它们。
总表支持:
- long、double 和 int 数据类型
- 同时显示来自不同 assets 和不同 aspects 的 variables
示例
接口
### 选择器
<mdsp-aggregate-chart></mdsp-aggregate-chart>
属性
| 名称 | 类型 | 相应的属性 | 默认 | 描述 | 允许的值 |
|---|---|---|---|---|---|
| context | string | context | 配置组件的上下文。同样参见这里。 | ||
| dateRange | IDateRange | 使用 from 和 to 指定当前日期范围,请参考 IDateRange 模型。 | |||
| errorNotification | boolean | error-notification | 如果有错误抛出,启用错误控件。这可以用于调试目的。 对于在生产环境中使用,应在应用中捕获并处理错误事件。同样参见这里。 | ||
| legendDisabled | boolean | legend-disabled | false | 如果为 true,则禁用图表的图例。 | |
| locale | string | locale | 指定显示组件的时间区域 默认提供时间区域 en 和 de。同样参见这里。 | ||
| localeManager | LocaleManager | 返回 LocaleManager 对象。 它可用于添加时间区域或者时间区域的设置。 同样参见这里。 | |||
| model | IDataModel | 返回用于数据模型处理的对象,请参考 IDataModel 模型。 | |||
| variablePaths | AggregatePath | 指定一个对象数组,该数组定义要在图表中显示的变量。请参见以下代码段。 | |||
| view | IViewModel | 返回用于视图处理的对象,请参考 IViewModel 模型。 | |||
| wheelZoom | boolean | wheel-zoom | false | 如果为 true,启用通过鼠标滚轮的缩放控件。否则,必须按下 control 键进行缩放。要求 禁用缩放为 false。 | |
| zoomDisabled | boolean | zoom-disabled | false | 如果为 true,禁用图表缩放。 |
事件
| 名称 | 类型 | 描述 |
|---|---|---|
| dateRangeChanged | EventEmitter<IDateRange> | 当日期范围改变时触发,例如:用户在图表中缩放或移动。 |
| connected | EventEmitter<any> | 在组件被创建、初始化并附加到 DOM 树后触发。 |
| error | EventEmitter<MdspUiError> | 当组件或正在访问 API 发生错误时触发。同样参见这里。 |
模型
IDateRange
  interface IDateRange {
     from: Date;
     to: Date;
  }
IDataModel
interface IDataModel {
  // forces reload of data // forces reload of data, e.g. re-loading the chart
  refresh(): void;
}
IViewModel
interface IViewModel {
  refresh(): void;
}
备注
- 出于性能原因,建议将总表中显示的 variables 数量限制为10。
角色
mdsp:core:iot.tsaUser(使用 IoT Aggregates API)
代码段
显示一个 aspect 的所有 variables
您可以传递一个对象来指定 aspect,也可以提供完整的路径。
```javascript tab="Object" aggregateChart.variablePaths = [ // Show all variables of a given aspect { assetId: '89bba0c1e19c4884bce75d8bcc3773e5', aspectName: 'AspectNameX' } ];
```javascript tab="Path"
aggregateChart.variablePaths = [
   // Convenient Syntax: write the path to the assetId/aspect
   '89bba0c1e19c4884bce75d8bcc3773e5/AspectNameX'
];
显示特定的 variables
您可以传递一个对象来指定显示的 variables ,也可以提供完整的路径。
```javascript tab="Object" aggregateChart.variablePaths = [ // Show specific variables of an aspect { assetId: 'f9f1ff3ccaa1401a98cf37d0c9144c7e', aspectName: 'AspectNameX', variables: ['VariableName1', ...,'VariableNameN'] } ];
```javascript tab="Path"
aggregateChart.variablePaths = [
   // Convenient Syntax: write the path to the assetId/aspect/variableName1&variableName2.. etc.
   'f9f1ff3ccaa1401a98cf37d0c9144c7e/AspectNameX/VariableName1&...&VariableNameN'
];
使用 Aspect Variable Selector 上传 variables
使用 Aspect Variable Selector 触发的事件来更新要显示在总表中的 variables。一个更加详细的代码示例在此处给出。
aspectVariableSelectorComp.addEventListener('selectedAspectsAndVariablesChanged', function (eventParams) {
            timeseriesAggregateComp.variablePaths = eventParams.detail;
        });
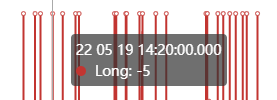
在 Overlay 中更改时间戳格式
const chartComp = document.querySelector('mdsp-aggregate-chart');
const localeSettings = chartComp.localeManager.getLocaleSettings();
localeSettings.tooltipTimestampFormat = "DD MM YY HH:mm:ss.SSS";
chartComp.localeManager.addLocale("en-custom", localeSettings);
chartComp.locale = "en-custom";
还有问题?
除非另行声明,该网站内容遵循MindSphere开发许可协议.