Example for using Vega dashboard node
In this example, you can read the weather report in the CSV format and convert to JSON and then the output is displayed on the dashboard using the Vega dashboard node.
Example
Let us consider an example to read CSV formatted data and convert to JSON and then display the output on the dashboard:
-
Create the flow as shown below:
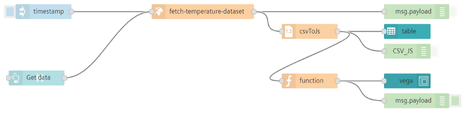
-
Edit http request node properties.
- URL: "https://cdn.jsdelivr.net/npm/vega-datasets@2.2.0/data/seattle-weather-hourly-normals.csv"
-
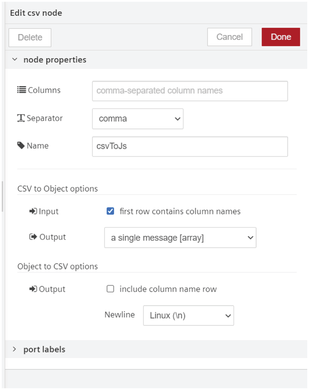
Edit csv node properties.
-
Edit function node properties.
- Code:
Code
// store msg let mytmpdata = msg.payload; msg.payload = { "$schema": "https://vega.github.io/schema/vega/v5.json", "description": "A heatmap showing average daily temperatures in Seattle for each hour of the day.", "width": 800, "height": 500, "padding": 5, "title": { "text": "Seattle Annual Temperatures", "anchor": "middle", "fontSize": 16, "frame": "group", "offset": 4 }, "signals": [ { "name": "palette", "value": "Viridis", "bind": { "input": "select", "options": [ "Turbo", "Viridis", "Magma", "Inferno", "Plasma", "Cividis", "DarkBlue", "DarkGold", "DarkGreen", "DarkMulti", "DarkRed", "LightGreyRed", "LightGreyTeal", "LightMulti", "LightOrange", "LightTealBlue", "Blues", "Browns", "Greens", "Greys", "Oranges", "Purples", "Reds", "TealBlues", "Teals", "WarmGreys", "BlueOrange", "BrownBlueGreen", "PurpleGreen", "PinkYellowGreen", "PurpleOrange", "RedBlue", "RedGrey", "RedYellowBlue", "RedYellowGreen", "BlueGreen", "BluePurple", "GoldGreen", "GoldOrange", "GoldRed", "GreenBlue", "OrangeRed", "PurpleBlueGreen", "PurpleBlue", "PurpleRed", "RedPurple", "YellowGreenBlue", "YellowGreen", "YellowOrangeBrown", "YellowOrangeRed" ] } }, { "name": "reverse", "value": false, "bind": {"input": "checkbox"} } ], "data": [ { "name": "temperature", "url": "data/seattle-weather-hourly-normals.csv", // "format": {"type": "csv", "parse": {"temperature": "number", "date": "date"}}, "transform": [ {"type": "formula", "as": "hour", "expr": "hours(datum.date)"}, { "type": "formula", "as": "day", "expr": "datetime(year(datum.date), month(datum.date), date(datum.date))"} ] } ], "scales": [ { "name": "x", "type": "time", "domain": {"data": "temperature", "field": "day"}, "range": "width" }, { "name": "y", "type": "band", "domain": [ 6, 7, 8, 9, 10, 11, 12, 13, 14, 15, 16, 17, 18, 19, 20, 21, 22, 23, 0, 1, 2, 3, 4, 5 ], "range": "height" }, { "name": "color", "type": "linear", "range": {"scheme": {"signal": "palette"}}, "domain": {"data": "temperature", "field": "temperature"}, "reverse": {"signal": "reverse"}, "zero": false, "nice": true } ], "axes": [ {"orient": "bottom", "scale": "x", "domain": false, "title": "Month", "format": "%b"}, { "orient": "left", "scale": "y", "domain": false, "title": "Hour", "encode": { "labels": { "update": { "text": {"signal": "datum.value === 0 ? 'Midnight' : datum.value === 12 ? 'Noon' : datum.value < 12 ? datum.value + ':00 am' : (datum.value - 12) + ':00 pm'"} } } } } ], "legends": [ { "fill": "color", "type": "gradient", "title": "Avg. Temp (°C)", "titleFontSize": 12, "titlePadding": 4, "gradientLength": {"signal": "height - 16"} } ], "marks": [ { "type": "rect", "from": {"data": "temperature"}, "encode": { "enter": { "x": {"scale": "x", "field": "day"}, "y": {"scale": "y", "field": "hour"}, "width": {"value": 5}, "height": {"scale": "y", "band": 1}, "tooltip": {"signal": "timeFormat(datum.date, '%b %d %I:00 %p') + ': ' + datum.temperature + '°'"} }, "update": { "fill": {"scale": "color", "field": "temperature"} } } } ] }; const jsonString = JSON.stringify(mytmpdata); console.log("---------"); console.log(jsonString); console.log("-==------"); const myobj = JSON.parse(jsonString); //ok const xdata = [{"date":"2010-12-30T11:00:00","pressure":1018.3,"temperature":4.9,"wind":3.8},{"date":"2010-12-30T12:00:00","pressure":1017.9,"temperature":5.6,"wind":3.8},{"date":"2010-12-30T13:00:00","pressure":1017.5,"temperature":5.9,"wind":4},{"date":"2010-12-30T14:00:00","pressure":1017.2,"temperature":6.2,"wind":4.1}]; //ok msg.payload.data[0].values = xdata; msg.payload.data[0].values = myobj; console.log("typecheck "+ typeof xdata); return msg; -
Save and execute the flow.
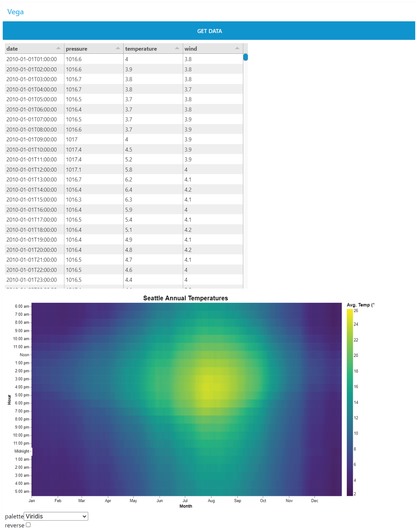
Result
Open Visual Flow Creator dashboard to view the output.
Last update: January 22, 2024