Using analytics nodes
You can use analytics nodes to analyze and process time series data from Industrial IoT with standardized analytics methods. The assignable parameters control the analytics node.
Example scenario
The owner of the logistics center of the smart city would like to view the energy consumption of its cranes over different time periods: hour, day, week and month.
The previously created flow allows the power peaks of a crane to be identified.
Objective
A distribution of the energy demand is to be determined and the average displayed.
Requirement
- The crane is connected to Industrial IoT and collects the energy data.
- The flow for determining the energy consumption of the cranes has already been created in Visual Flow Creator.
Procedure
To use an analytics node, follow these steps:
- Open the flow for determining the energy consumption of the cranes.
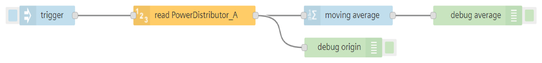
- Move the "moving average" node to the working area using drag-and-drop.
- Insert the "moving average" node in the flow for determining the energy consumption of the crane.
- To activate the flow, click the blue button to the left of the ""timestamp"" node.
Result
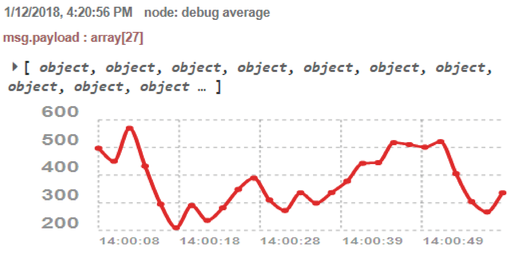
The existing flow uses the analytics node "moving average" to generate a moving average of the energy consumption of the crane.
The steep edges of the energy consumption acquired become flatter and reflect a consumption profile that can be interpreted much more effectively based on a lower resolution.
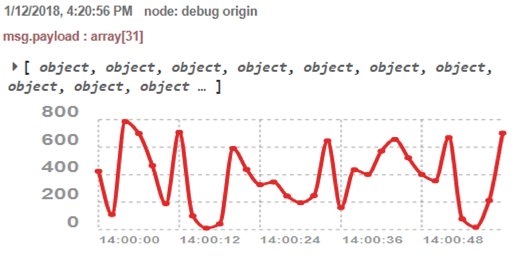
The following graphic shows the graph without smoothed data:
The following graphic shows the graph with smoothed data: