Usages of standard dashboard nodes
This section describes the dashboard nodes available in Visual Flow Creator.
You can edit the node properties as per requirements. You can set the state of dashboard widgets by sending messages to the corresponding nodes. You can read or react to values set by users of the dashboard by appending nodes to the outputs of the dashboard nodes.
Note
Industrial IoT is not responsible for the complex dashboard nodes adopted from third party like Vega, Heat map, etc. For more information about the third party dashboard nodes, refer to their official websites.
Button
![]()
The node will generate a message with payload and topic defined in node settings. By default, the button sends a string with message id as payload. Clicking the button results in generating the message loaded in the payload.
Output in the dashboard window:
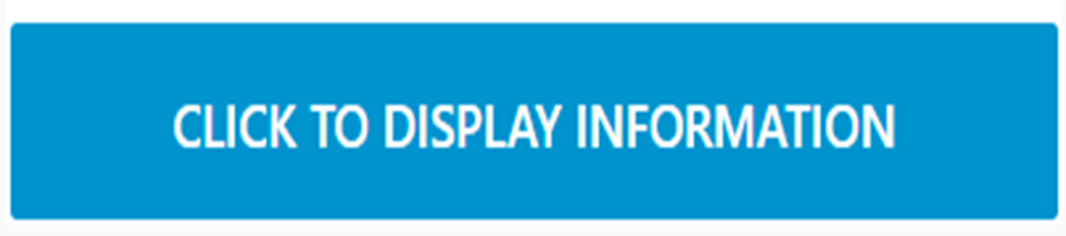
Here the size, color and label of the button has been edited to design a useful flow.
Dropdown
![]()
You can use the "dropdown" node to define multiple possible data values. Supported data types are string, number and boolean.
Output in the dashboard window:
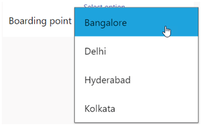
You can customize the dropdown menu by editing the node properties. The "options" field in the node properties allows you to add the required options to design the dropdown menu.
Switch
![]()
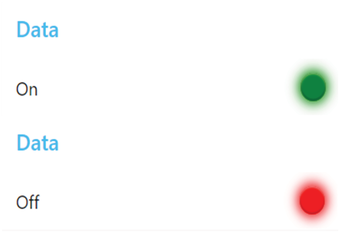
The switch node returns any kind of value (string/ number/ boolean/ json) when it changes state.
Output in the dashboard window:

The first switch shown is in the "off" mode, and the second switch is in the "on" mode.
Slider
![]()
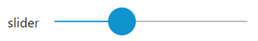
You can set the value of the horizontal slider by sending a message to the node. You can react to a user's change to a slider by listening to the output message of the slider node. In order to both set the value and react to the new value, you can select "If msg arrives on input, pass through to output" in the node properties. A slider is defined in terms of the following parameters:
- A minimum value
- A maximum value
- A step value
Input messages are converted to a number. The minimum value is used if conversion fails, and this will update the user interface or dashboard window. If the value changes, it will be passed to the output.
Output in the dashboard window:
Numeric
![]()
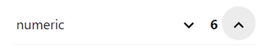
Like the slider, you can use the numeric node to define a range of values in steps with a minimum value and a maximum value.
Output in the dashboard window:
Text input
The node adds a text input to the dashboard window. The text input node supports the following modes:
- Regular text
- Email address
- Password
- Number
- Telephone input
- Color picker
- Time picker
- Week picker
- Month picker
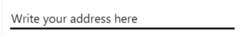
Output in the dashboard window:
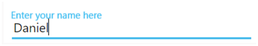
Here, the text input label has been changed to "Enter your name here".
Data picker
The date picker node allows you to pick dates from the widget.
Output in the dashboard window:
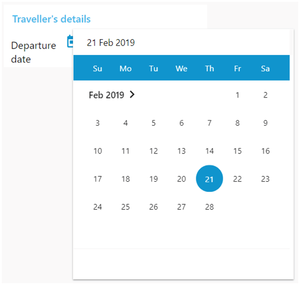
Here, the date picker label has been changed to "Departure date".
Colour picker
This node uses the color selector of the system and returns the color in rgb, hex, hex8, hsv or hsl format. Transparency is also supported for all except hex.
Output in the dashboard window:
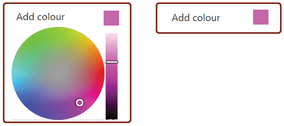
The node label has been edited to "Add colour". Click the color box and a dropdown to choose color will appear. You can then choose the required color.
Form
![]()
The form node helps you to accumulate multiple form elements and then submit them on a single click as an object.
Output in the dashboard window:
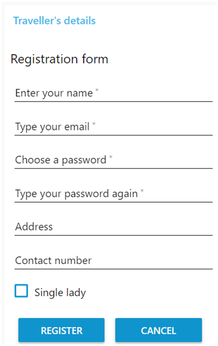
You can edit the node properties of the "form" and design the form in the "form elements" section according to requirements.
Text
![]()
The text node is a read-only widget where you can configure the label and value.
Output in the dashboard window:
You can customize the text box label for a read-only message.
Gauge
![]()
The gauge node is of four types:
- Standard gauge
- Donut
- Compass
- Level
You can define the ranges with different colors for the gauge nodes.
Output in the dashboard window:
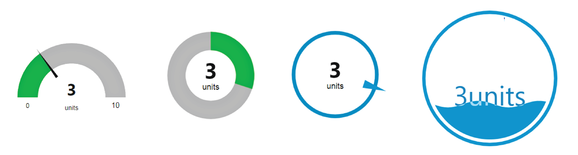
The "gauge" dashboard widget can be customized to appear as one of four possible types.
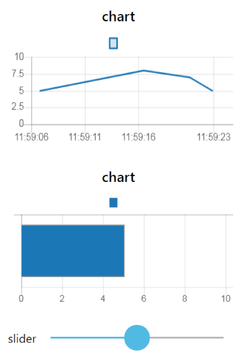
Chart
![]()
The chart node can be designed in the following formats:
- Line
- Bar
- Pie
Chart nodes are helpful for multiple data readings. Charts are useful for representations and comparisons of numeric and quantitative information.
Output in the dashboard window:
Notification
![]()
The node creates user alerts as popup notifications.
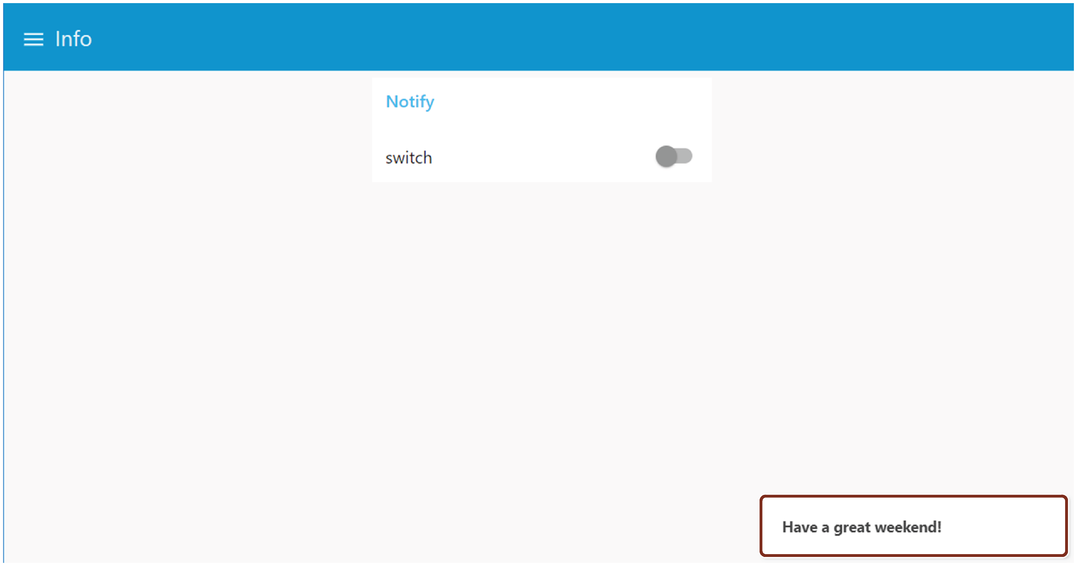
Output in the dashboard window:
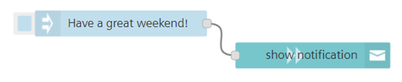
Let us consider the following example:
The notification is configured to be displayed on the bottom right. You get the following message in the dashboard window:
UI control
![]()
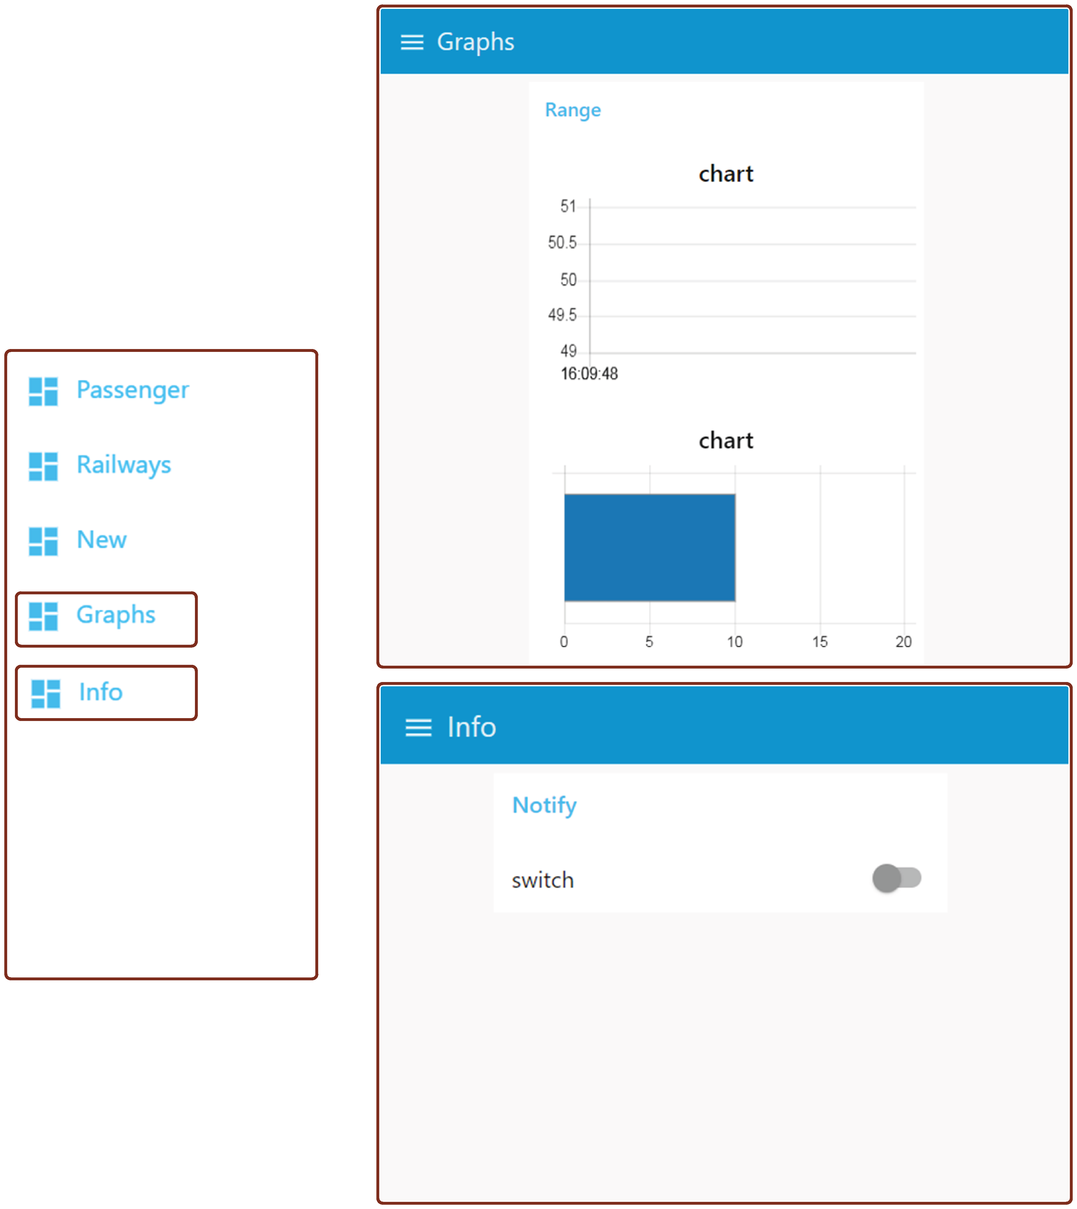
The ui control node allows some dynamic control of the dashboard. Sending a msg.payload of the tab number (from 0) or tab_name will switch to that tab. It refreshes the current opened page if the message contains an empty or unset "tab" property.
Output in the dashboard window:
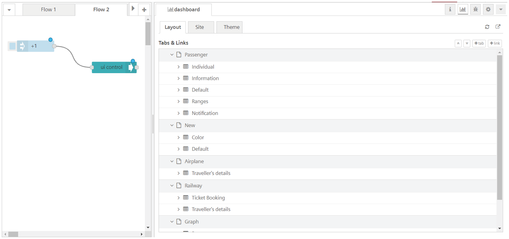
Let us consider the following flow with the defined dashboard groups in the sidebar:
The input node is defined with string "+1". This opens the next tab incrementally in the dashboard window.
Similarly, if you define the input node with string "-1", the dashboard window will change to the previous tab, in a reverse order.
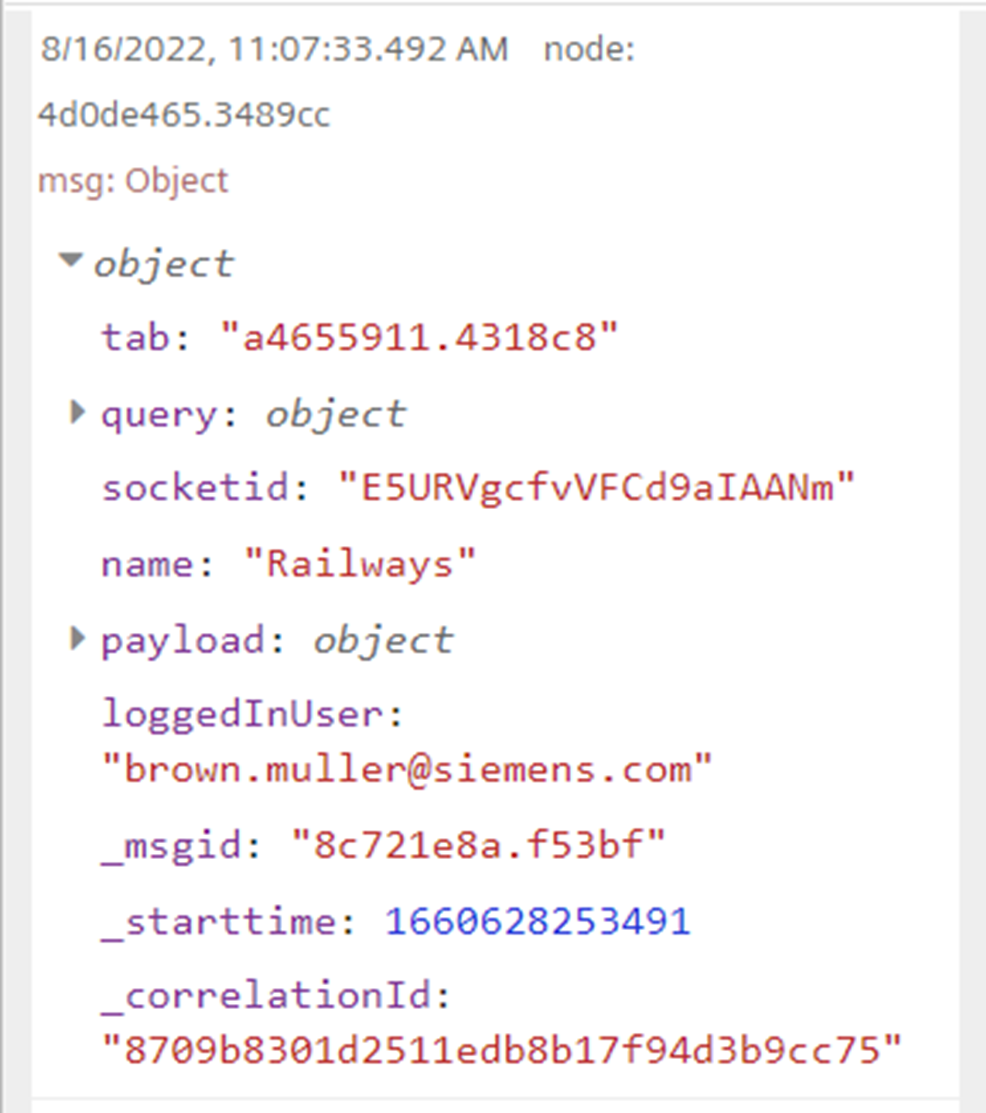
When you perform some activity in the dashboard window, this node connected with debug node will display the message of payload and loggedInUser details in the message payload.
Template
![]()
The template node allows you to create and define your own widgets. You can design the widgets within the framework using HTML, JavaScript. You can also override builds in CSS styles.
You can create a template and save it in the library for re-use.
Output in the dashboard window:
Let us consider the simple code given below:
You get the following message in the dashboard window:
Image
![]()
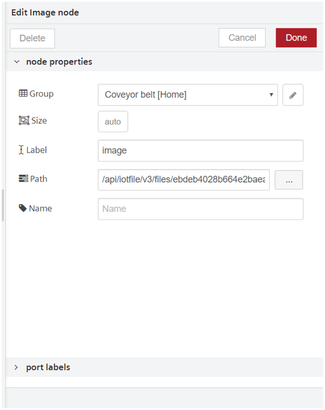
The image node allows you to add an image to the dashboard in the user interface. It supports different types of image formats. The image file can be uploaded using Insights Hub Monitor. The path represents the File API path to image resource.
Procedure to upload the image
To upload the image file to image node, follow these steps:
-
Double click the image node.
-
Click
 to add the image from the "Select an Image" dialog box.
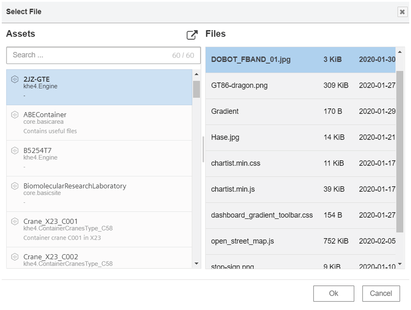
-
Select file and click "Ok".
- Click "Done".
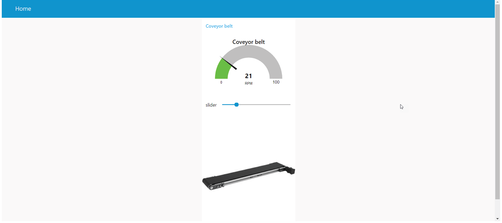
Output in the dashboard window
Let us consider the following flow as an example:
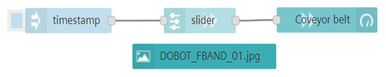
Open Visual Flow Creator dashboard to view the output.
Note
The image should be available in Insights Hub Monitor application before using it to Image node.
JS/CSS
![]()
The JS or CSS node allows you to embed custom JS and/or CSS files to the VFC Dashboard. All JS/CSS files will be embedded according theirs sequence numbers. The .js or .css file can be uploaded using Insights Hub Monitor.
Procedure to upload the .js or .css file
To upload the .js or .css file to JS/CSS node, follow these steps:
-
Double click the JS/CSS node.
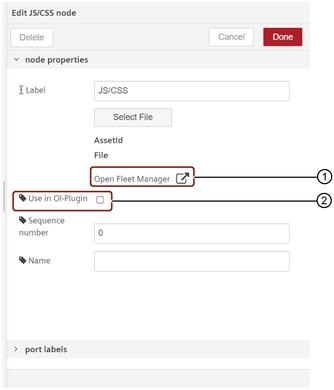
① Insights Hub Monitor plugin
② Operations Insight plugin
-
Click "Select File" button.
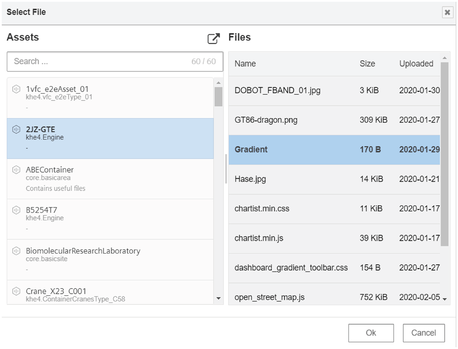
-
Select file and click "Ok".
- Select the sequence number.
- Click "Done".
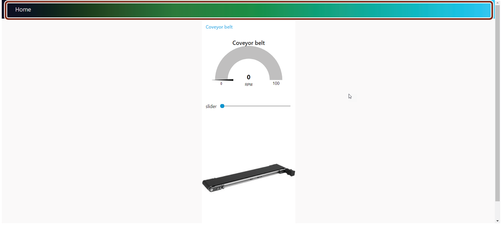
Output in the dashboard window:
Let us save the below code in .css file and upload the file to Insights Hub Monitor.
  #nr-dashboard-toolbar {
          background: rgb(2,0,36);
          background: linear-gradient(90deg, rgba(2,0,36,1) 0%, rgba(41,121,9,1) 35%, rgba(0,206,255,1) 100%);
  }
For example, the above code will change the tab ribbon color from blue to gradient as shown below:
Note
- The file should be available in Insights Hub Monitor application before using it to JS/CSS node.
- Define the sequence number to order the files which will be embedded into the HTML page.
Use Insights Hub Monitor and Operations Insight plugin to load the dashboard for all the users. Now, it is possible to create the dashboards from one user to another user.
Note
The scripts are loaded with a delay after the page loads, you can use the below example code to load the page with a delay.
- Example code:
html <script> setTimeout (() => {$('#myID').html('Hi')}; }, 100); </script> <div ng-bind-html="msg.payload" id="myID"> </div>
IFrame
![]()
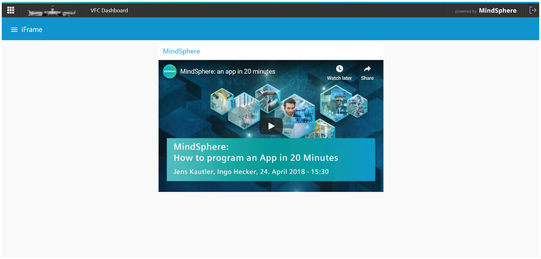
The IFrame node allows you to embed an external webpage in Visual Flow Creator dashboard.
Note
Adhere to the Content Security Policy (CSP) of the external websites for the protection against attacks, malicious content and other mitigates issues.
Example to embed an external webpage**
To embed the external webpage in Visual Flow Creator dashboard using iFrame node, follow these steps:
-
Double click the iFrame node.
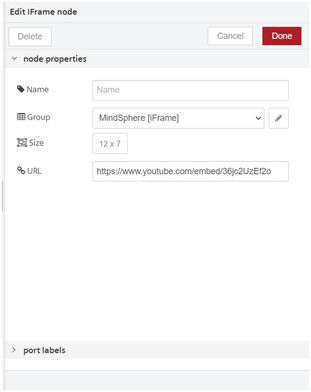
-
Enter the URL.
- Click Done.
Output in the dashboard window:
Open Visual Flow Creator dashboard to view the output.
Minerva
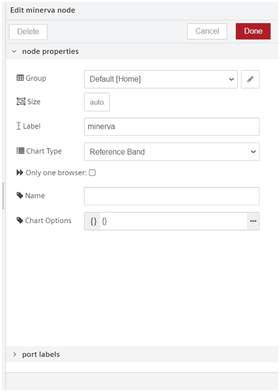
![]()
The Minerva node allows you to add the web widgets to the dashboard. It includes the following widgets:
- Bullet Chart
- Reference Band
- Recursive Pattern
- Cyclic Angle Time Spiral
- Smart Color Designer
- DBSCAN Param
- DBSCAN Scoring
- Ranked Stream Graph
- Confusion Matrix
Each widget will be configured using data taken from msg.payload. For more information about the widgets, refer to the info tab of minerva node.
Example
To add the web widgets to the dashboard, follow these steps:
-
Create the flow as shown below:

-
Edit function node:
- Code:
Code
{ "data": [ { "timestamp": "2016-04-05 00:00:30.976", "id": "671121446" }, { "timestamp": "2016-04-05 00:00:33.984", "id": "1000005" }, { "timestamp": "2016-04-05 00:00:33.988", "id": "1000005" }, { "timestamp": "2016-04-05 00:00:35.98", "id": "671121446" }, { "timestamp": "2016-04-05 00:00:39.992", "id": "671121446" }, { "timestamp": "2016-04-05 00:00:42.996", "id": "679477920" }, { "timestamp": "2016-04-05 00:00:44", "id": "679477924" }, { "timestamp": "2016-04-05 00:01:50.004", "id": "679477929" }, { "timestamp": "2016-04-05 00:01:57.008", "id": "679477921" }, { "timestamp": "2016-04-05 00:02:38.012", "id": "679477928" }, { "timestamp": "2016-04-05 00:03:29.016", "id": "687964883" }, { "timestamp": "2016-04-05 00:04:02.02", "id": "1000005" }, { "timestamp": "2016-04-05 00:04:02.024", "id": "1000005" } ], "options": { "height": "400px", "variableStreamWidth": false, "nrOfPeriods": 7, "nrOfRanks": 6, "periodWidth": 70, "averageStreamWidth": 60, "extensionsHeight": 100, "colorscheme": [ "#33a02c", "#a6cee3", "#fb9a99", "#b2df8a", "#fdbf6f", "#1f78b4", "#e31a1c", "#ffff99", "#cab2d6", "#ff7f00", "#b15928", "#6a3d9a", "#8dd3c7", "#ffffb3", "#bebada", "#fb8072", "#80b1d3", "#fdb462", "#fccde5", "#b3de69", "#ffed6f", "#d9d9d9", "#bc80bd", "#ccebc5" ] } } -
Edit minerva node:
-
Save the flow.
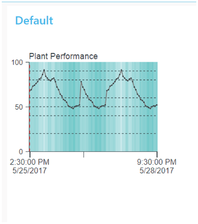
Output in the dashboard window:
Open Visual Flow Creator dashboard to view the output.
Heat map
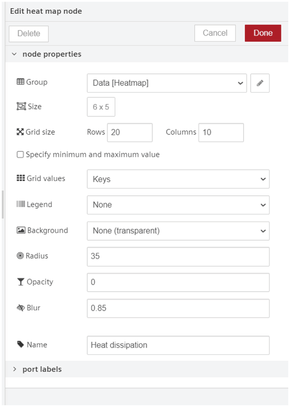
![]()
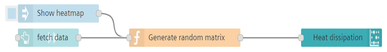
The Heat map node allows you to create a graphical representation of the data, where the individual values contained in a matrix are represented as colors. For more information, refer to the info tab of heat map node.
Example
To execute the example flow using heatmap node, follow these steps:
-
Create the flow as shown below:
-
Edit function node properties:
- Name: Generate random matrix
- Code:
var len = 200; msg.payload = []; while (len--){ var value = Math.floor(Math.random()*100); msg.payload.push(value); } return msg; -
Edit heat map node properties.
-
Save and execute the flow.
Output in the dashboard window:
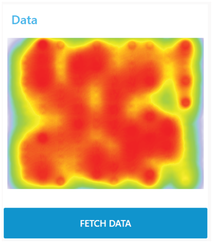
Open Visual Flow Creator dashboard to view the output.
LED
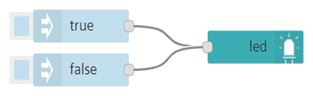
![]()
The LED node allows you to create a simple LED status indicator for the Dashboard. For more information, refer to the info tab of LED node.
Example
To execute the example flow using LED node, follow these steps:
-
Create the flow as shown below:
-
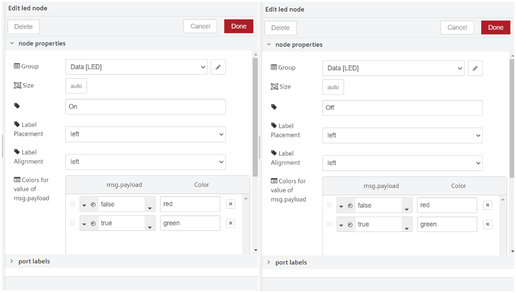
Edit LED node properties.
Note
To add more colors to the LED node, click "+Color".
3.Save and execute the flow.
Output in the dashboard window:
Open Visual Flow Creator dashboard to view the output.
Linear gauge
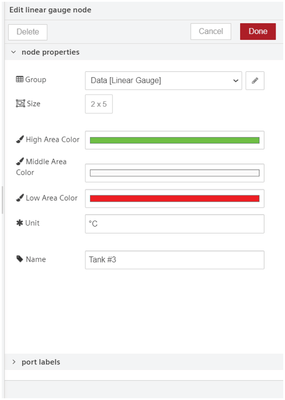
![]()
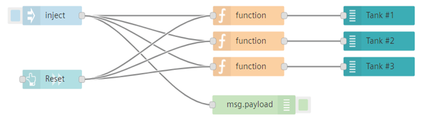
The Linear gauge node allows you to create a linear gauge with high or low limits and animatedsliding pointer. For more information, refer to the info tab of linear gauge node.
Example
To execute the example flow using linear gauge node, follow these steps:
-
Create the flow as shown below:
-
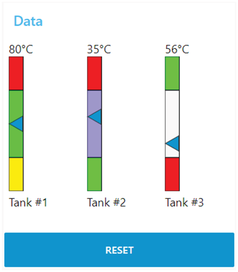
Edit function (Tank #1) node properties:
- Code:
msg.payload = 80; msg.highlimit = 150; msg.lowlimit = 10; msg.setpoint = 75; return msg; -
Edit function (Tank #2) node properties:
- Code:
msg.payload = 35; msg.highlimit = 50; msg.lowlimit = 12; msg.setpoint = 45; return msg; -
Edit function (Tank #3) node properties:
- Code:
msg.payload = 56; msg.highlimit = 250; msg.lowlimit = 5; msg.setpoint = 88; return msg; -
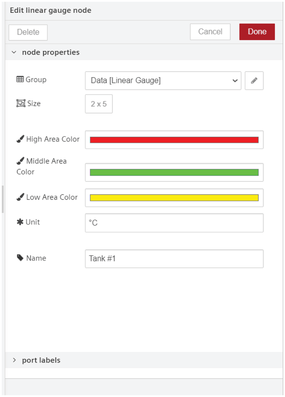
Edit linear gauge (Tank #1) node properties.
-
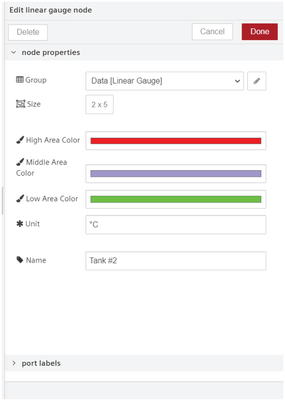
Edit linear gauge (Tank #2) node properties.
-
Edit linear gauge (Tank #3) node properties.
-
Save and execute the flow.
Output in the dashboard window:
Open Visual Flow Creator dashboard to view the output.
Microphone
![]()
The Microphone node allows you to create an audio to be recorded and allows speech recognition from the dashboard. For more information, refer to the info tab of microphone node.
Example
To execute the example flow using microphone node, follow these steps:
-
Create the flow as shown below:
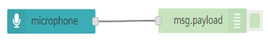
-
Save and execute the flow.
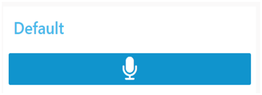
Output in the dashboard window:
Open Visual Flow Creator dashboard to view the output and start recording from the dashboard.
Statechart
![]()
The Statechart node allows you to create a bar chart to visualize numeric values in relation, together with state represented by color. For more information, refer to the info tab of statechart node.
Example
To execute the example flow using statechart node, follow these steps:
-
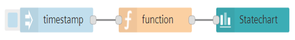
Create the flow as shown below:
-
Edit function node properties:
- Code:
msg.payload = [{ series: "2010", value: 300000, state: true }, { series: "2012", value: 400000, state: true }, { series: "2014", value: 500000, state: true }, { series: "2016", value: 600000, state: true }, { series: "2018", value: 700000, state: true }, { series:"2020", value: 800000, state: true }] return msg; -
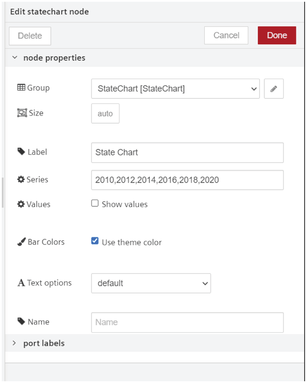
Edit statechart node properties:
-
Save and execute the flow.
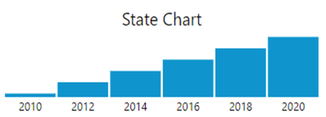
Output in the dashboard window
Open Visual Flow Creator dashboard to view the output.
Note
The default color theme can be changed using "Bar Colors" and "Text options" in "State chart" node properties.
Table
![]()
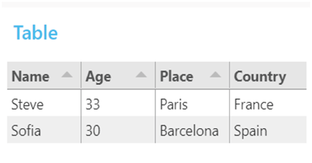
The Table node allows you to display the data as a table in the dashboard. For more information, refer to the info tab of table node.
Example
To execute the example flow using table node, follow these steps:
-
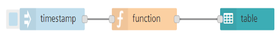
Create the flow as shown below:
-
Edit function node properties:
- Code:
msg.payload = [ { "Name": "Steve", "Age": "33", "Place": "Paris", "Country": "France" }, { "Name": "Sofia", "Age": "30", "Place": "Barcelona", "Country": "Spain" } ]; return msg; -
Save and execute the flow.
Output in the dashboard window:
Open Visual Flow Creator dashboard to view the output.
List
![]()
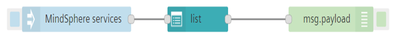
The List node allows you to create a list of the items. For more information, refer to the info tab of list node.
Example
To execute the example flow using list node, follow these steps:
-
Create the flow as shown below:
-
Edit inject node properties:
- Name: Insights Hub services
- Payload (JSON):
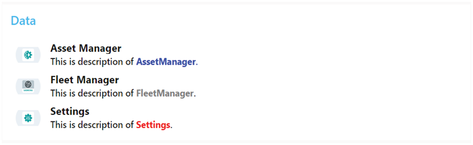
[ { "title": "<b>Asset Manager</b>", "description": "This is description of <fontcolor=\"blue\"><b>AssetManager</b></b>.", "icon": "https://siemens.mindsphere.io/en/docs/mindaccess/_jcr_content/root/container/division/content/dynamiccard/head/image.coreimg.svg/1596115731456/asset-manager-docsteaserkiosk-640x384.svg" }, { "title": "<b>Insights Hub Monitor</b>", "description": "This is description of <font color=\"Grey\"><b>FleetManager</b></font>.", "icon": "https://siemens.mindsphere.io/en/docs/mindaccess/_jcr_content/root/container/division/content/dynamiccard_copy_920548260/head/image.coreimg.svg/1597391606440/fleet-manager-docsteaserkiosk-640x384.svg" }, { "title": "<b>Settings</b>", "description": "This is description of <font color=\"red\"><b>Settings</b></font>.", "icon": "https://siemens.mindsphere.io/en/docs/mindaccess/_jcr_content/root/container/division/content/dynamiccard_copy/head/image.coreimg.svg/1596115743466/settings-docsteaserkiosk-640x384-2.svg" } ] -
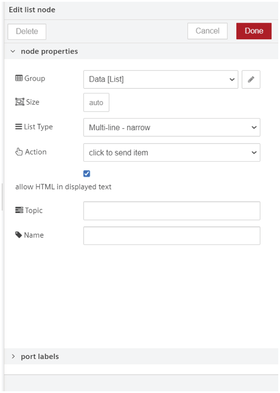
Edit list node properties:
-
Save and execute the flow.
Output in the dashboard window:
Open Visual Flow Creator dashboard to view the output.
Vega
![]()
The Vega node allows you to create a declarative data visualization using Vega visualization grammar. It also supports the Vega-lite specification. For more information, refer to the info tab of vega node.
Note
If you select "Only one browser" for a node in a flow, the node will handle each of the dashboards separately. For each browser, the communications originating from the node will be exclusively handled. If "Only one browser" is not selected, the node will share all the dashboard communication with every open browser from that user. For more information about an example on usage of one and multiple browsers, refer to Application examples on node properties.
Example
To execute the example flow using vega node, follow these steps:
-
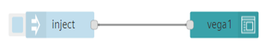
Create the flow as shown below:
-
Edit inject node properties:
- Payload (JSON):
Code
```json { "$schema": "https://vega.github.io/schema/vega/v5.json", "description": "An annotated line chart of the population of Falkensee, Germany.", "width": 500, "height": 250, "padding": 5, "config": { "title": { "fontSize": 16 } }, "title": { "text": {"signal": "'Population of Falkensee from ' + years[0] + ' to ' + years[1]"} },
    "data": [
        {
            "name": "table",
            "values": [
                {"year": 1875, "population": 1309},
                {"year": 1890, "population": 1558},
                {"year": 1910, "population": 4512},
                {"year": 1925, "population": 8180},
                {"year": 1933, "population": 15915},
                {"year": 1939, "population": 24824},
                {"year": 1946, "population": 28275},
                {"year": 1950, "population": 29189},
                {"year": 1964, "population": 29881},
                {"year": 1971, "population": 26007},
                {"year": 1981, "population": 24029},
                {"year": 1985, "population": 23340},
                {"year": 1989, "population": 22307},
                {"year": 1990, "population": 22087},
                {"year": 1991, "population": 22139},
                {"year": 1992, "population": 22105},
                {"year": 1993, "population": 22242},
                {"year": 1994, "population": 22801},
                {"year": 1995, "population": 24273},
                {"year": 1996, "population": 25640},
                {"year": 1997, "population": 27393},
                {"year": 1998, "population": 29505},
                {"year": 1999, "population": 32124},
                {"year": 2000, "population": 33791},
                {"year": 2001, "population": 35297},
                {"year": 2002, "population": 36179},
                {"year": 2003, "population": 36829},
                {"year": 2004, "population": 37493},
                {"year": 2005, "population": 38376},
                {"year": 2006, "population": 39008},
                {"year": 2007, "population": 39366},
                {"year": 2008, "population": 39821},
                {"year": 2009, "population": 40179},
                {"year": 2010, "population": 40511},
                {"year": 2011, "population": 40465},
                {"year": 2012, "population": 40905},
                {"year": 2013, "population": 41258},
                {"year": 2014, "population": 41777}
            ],
            "transform": [
                {
                    "type": "extent",
                    "field": "year",
                    "signal": "years"
                }
            ]
        },
    {
        "name": "annotation",
        "values": [
            {
                "start": 1933,
                "end": 1945,
                "text": "Nazi Rule"
            },
            {
                "start": 1948,
                "end": 1989,
                "text": "GDR (East Germany)"
            }
        ]
    }
],

"scales": [
    {
        "name": "x",
        "type": "linear",
        "range": "width",
        "zero": false,
        "domain": {"data": "table", "field": "year"}
    },
    {
        "name": "y",
        "type": "linear",
        "range": "height",
        "nice": true,
        "zero": true,
        "domain": {"data": "table", "field": "population"}
    },
    {
        "name": "color",
        "type": "ordinal",
        "domain": {"data": "annotation", "field": "text"},
        "range": ["black", "red"]
    }
],

"axes": [
    {
        "orient": "left",
        "scale": "y",
        "title": "Population",
        "titlePadding": 10,
        "grid": true
    },
    {
        "orient": "bottom",
        "scale": "x",
        "format": "d",
        "title": "Year",
        "tickCount": 15
    }
],

"marks": [
    {
        "type": "rect",
        "from": {"data": "annotation"},
        "encode": {
            "enter": {
                "x": {"scale": "x", "field": "start"},
                "x2": {"scale": "x", "field": "end"},
                "y": {"value": 0},
                "y2": {"signal": "height"},
                "fill": {"scale": "color", "field": "text"},
                "opacity": {"value": 0.2}
            }
        }
    },
    {
        "type": "line",
        "from": {"data": "table"},
        "encode": {
            "enter": {
                "interpolate": {"value": "monotone"},
                "x": {"scale": "x", "field": "year"},
                "y": {"scale": "y", "field": "population"},
                "stroke": {"value": "steelblue"},
                "strokeWidth": {"value": 3}
            }
        }
    },
    {
        "type": "symbol",
        "from": {"data": "table"},
        "encode": {
            "enter": {
                "x": {"scale": "x", "field": "year"},
                "y": {"scale": "y", "field": "population"},
                "stroke": {"value": "steelblue"},
                "strokeWidth": {"value": 1.5},
                "fill": {"value": "white"},
                "size": {"value": 30}
            }
        }
    }
],

"legends": [
    {
        "fill": "color",
        "title": "Period",
        "orient": "top-left",
        "offset": 8,
        "encode": {
            "symbols": {
                "update": {
                    "strokeWidth": {"value": 0},
                    "shape": {"value": "square"},
                    "opacity": {"value": 0.3}
                }
            }
        }
    }
  ]
}
```
-
Save and execute the flow.
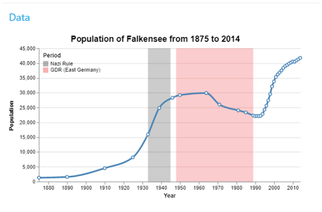
Output in the dashboard window
Open Visual Flow Creator dashboard to view the output.
Image/Video
The Image/Video node allows you to add an image/video to the dashboard. You can select the image/video source file from the “Select file” dialog or define using message property path.
Example
To execute the example flow using image/video node, follow these steps:
-
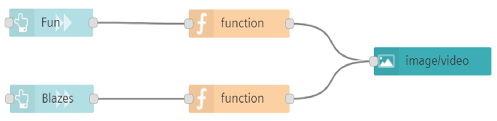
Create the flow as shown below:
-
Edit function node properties:
- Message property path (FUN):
msg.path = '/api/iotfile/v3/files/78ae02303cd448b997a08cdfd83e00d4/ForBiggerFun.mp4'; return msg;- Message property path (Blazes):
msg.path = '/api/iotfile/v3/files/78ae02303cd448b997a08cdfd83e00d4/ForBiggerBlazes.mp4'; return msg; -
Edit image/video node properties:
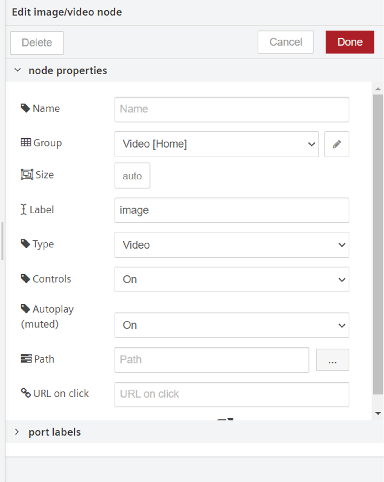
Note
If the "Video" type is selected: - Controls: It allows you to switch "On" or "Off" the controls of the audio file on the VFC dashboard. If you switch to "Off", the controls will be not visible on VFC dashboard. - Autoplay: It allows you to switch "On" or "Off" the autoplay of the video file on the VFC dashboard.
4.Save and execute the flow.
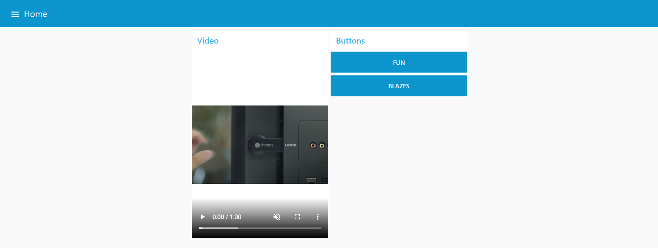
Output in the dashboard window
Open Visual Flow Creator dashboard to view the output. Click the "FUN" or "BLAZES" buttons to play the videos from the source.
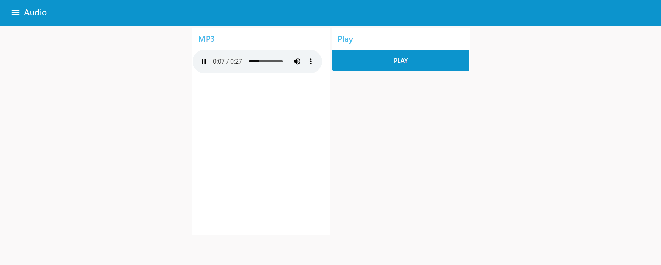
Audio
The Audio node allows you to add an audio player to the dashboard. You can select the audio source file from the “Select file” dialog or define using message property path.
Example
To execute the example flow using audio node, follow these steps:
-
Create the flow as shown below:

-
Edit function node properties:
- Message property path (PLAY):
msg.path = '/api/iotfile/v3/files/ebdeb4028b664e2baeab95a546f8b84f/file_example_MP3_1MG.mp3'; return msg; -
Edit audio node properties:
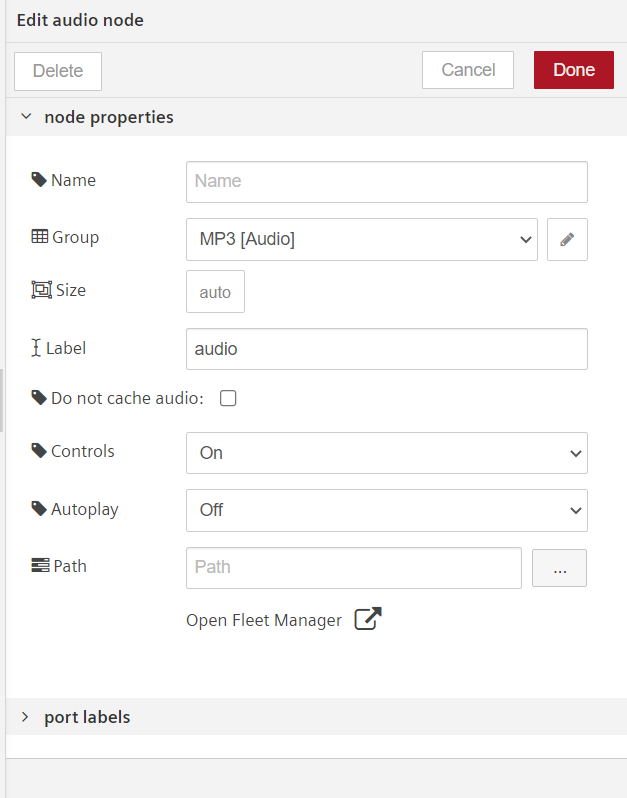
Note
- Controls: It allows you to switch "On" or "Off" the controls of the audio file on the VFC dashboard. If you switch to "Off", the controls will be not visible on VFC dashboard.
- Autoplay: It allows you to switch "On" or "Off" the autoplay of the audio file on the VFC dashboard.
4.Save and execute the flow.
Output in the dashboard window
Open Visual Flow Creator dashboard to view the output. Click the "PLAY" button to play the audio from the source.
etable
The etable node allows you to display the data in an interactive table format on Visual Flow Creator dashboard. This etable node displays the table data based on Tabulator library.
Example
To execute the example flow using etable node, follow these steps:
-
Create the flow as shown below:
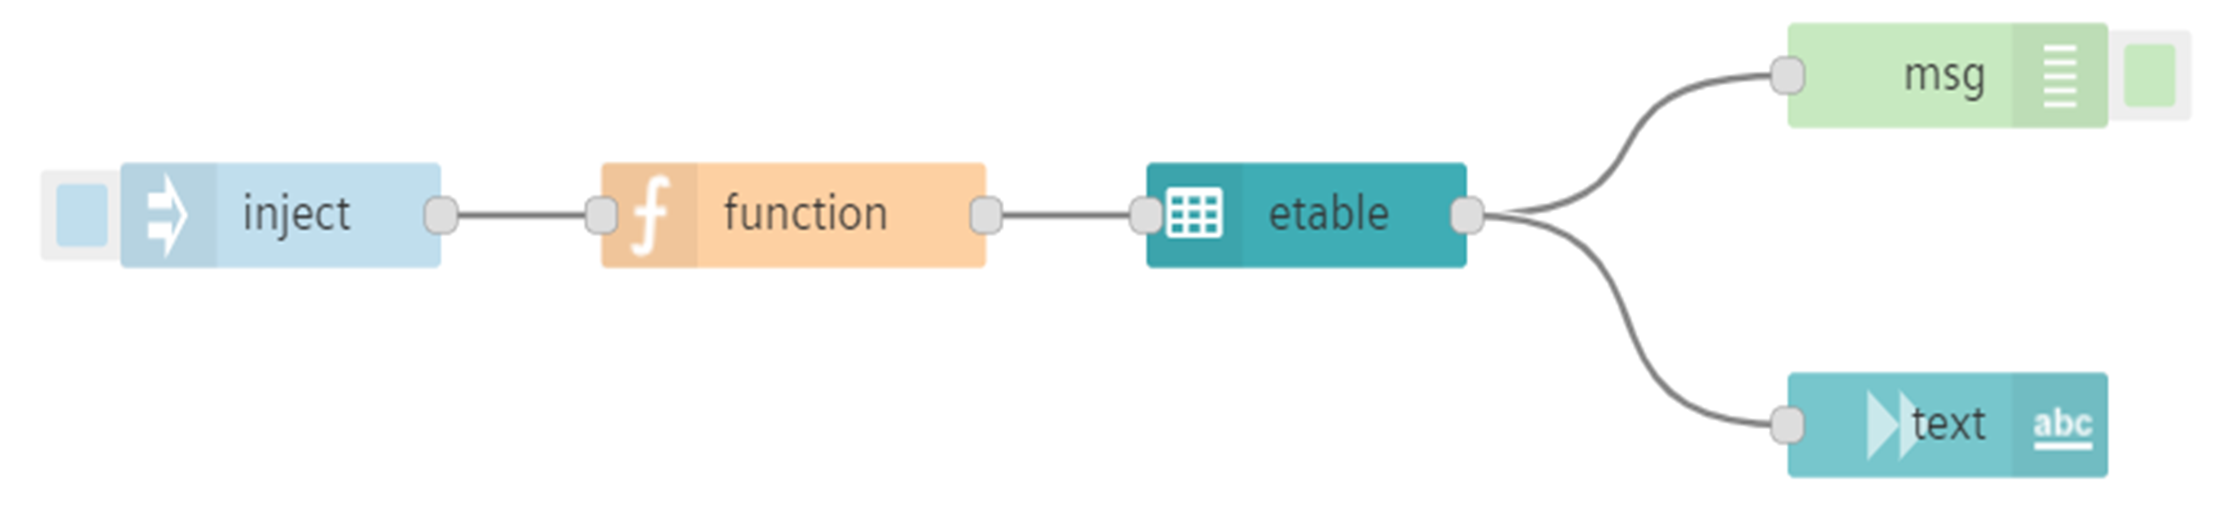
-
Edit function node properties:
In "function" node, enter the below JavaScript code in the "Code" field. - Code:
var machine1 = 'Generator'; var machine2 = 'Pump'; msg.payload = [ {"AssetType":machine1, progress:95, dom:"14/01/2022", rating:4}, {"AssetType":machine2, progress:90, dom:"15/02/2022", rating:3}]; return msg; -
Edit etable node properties:
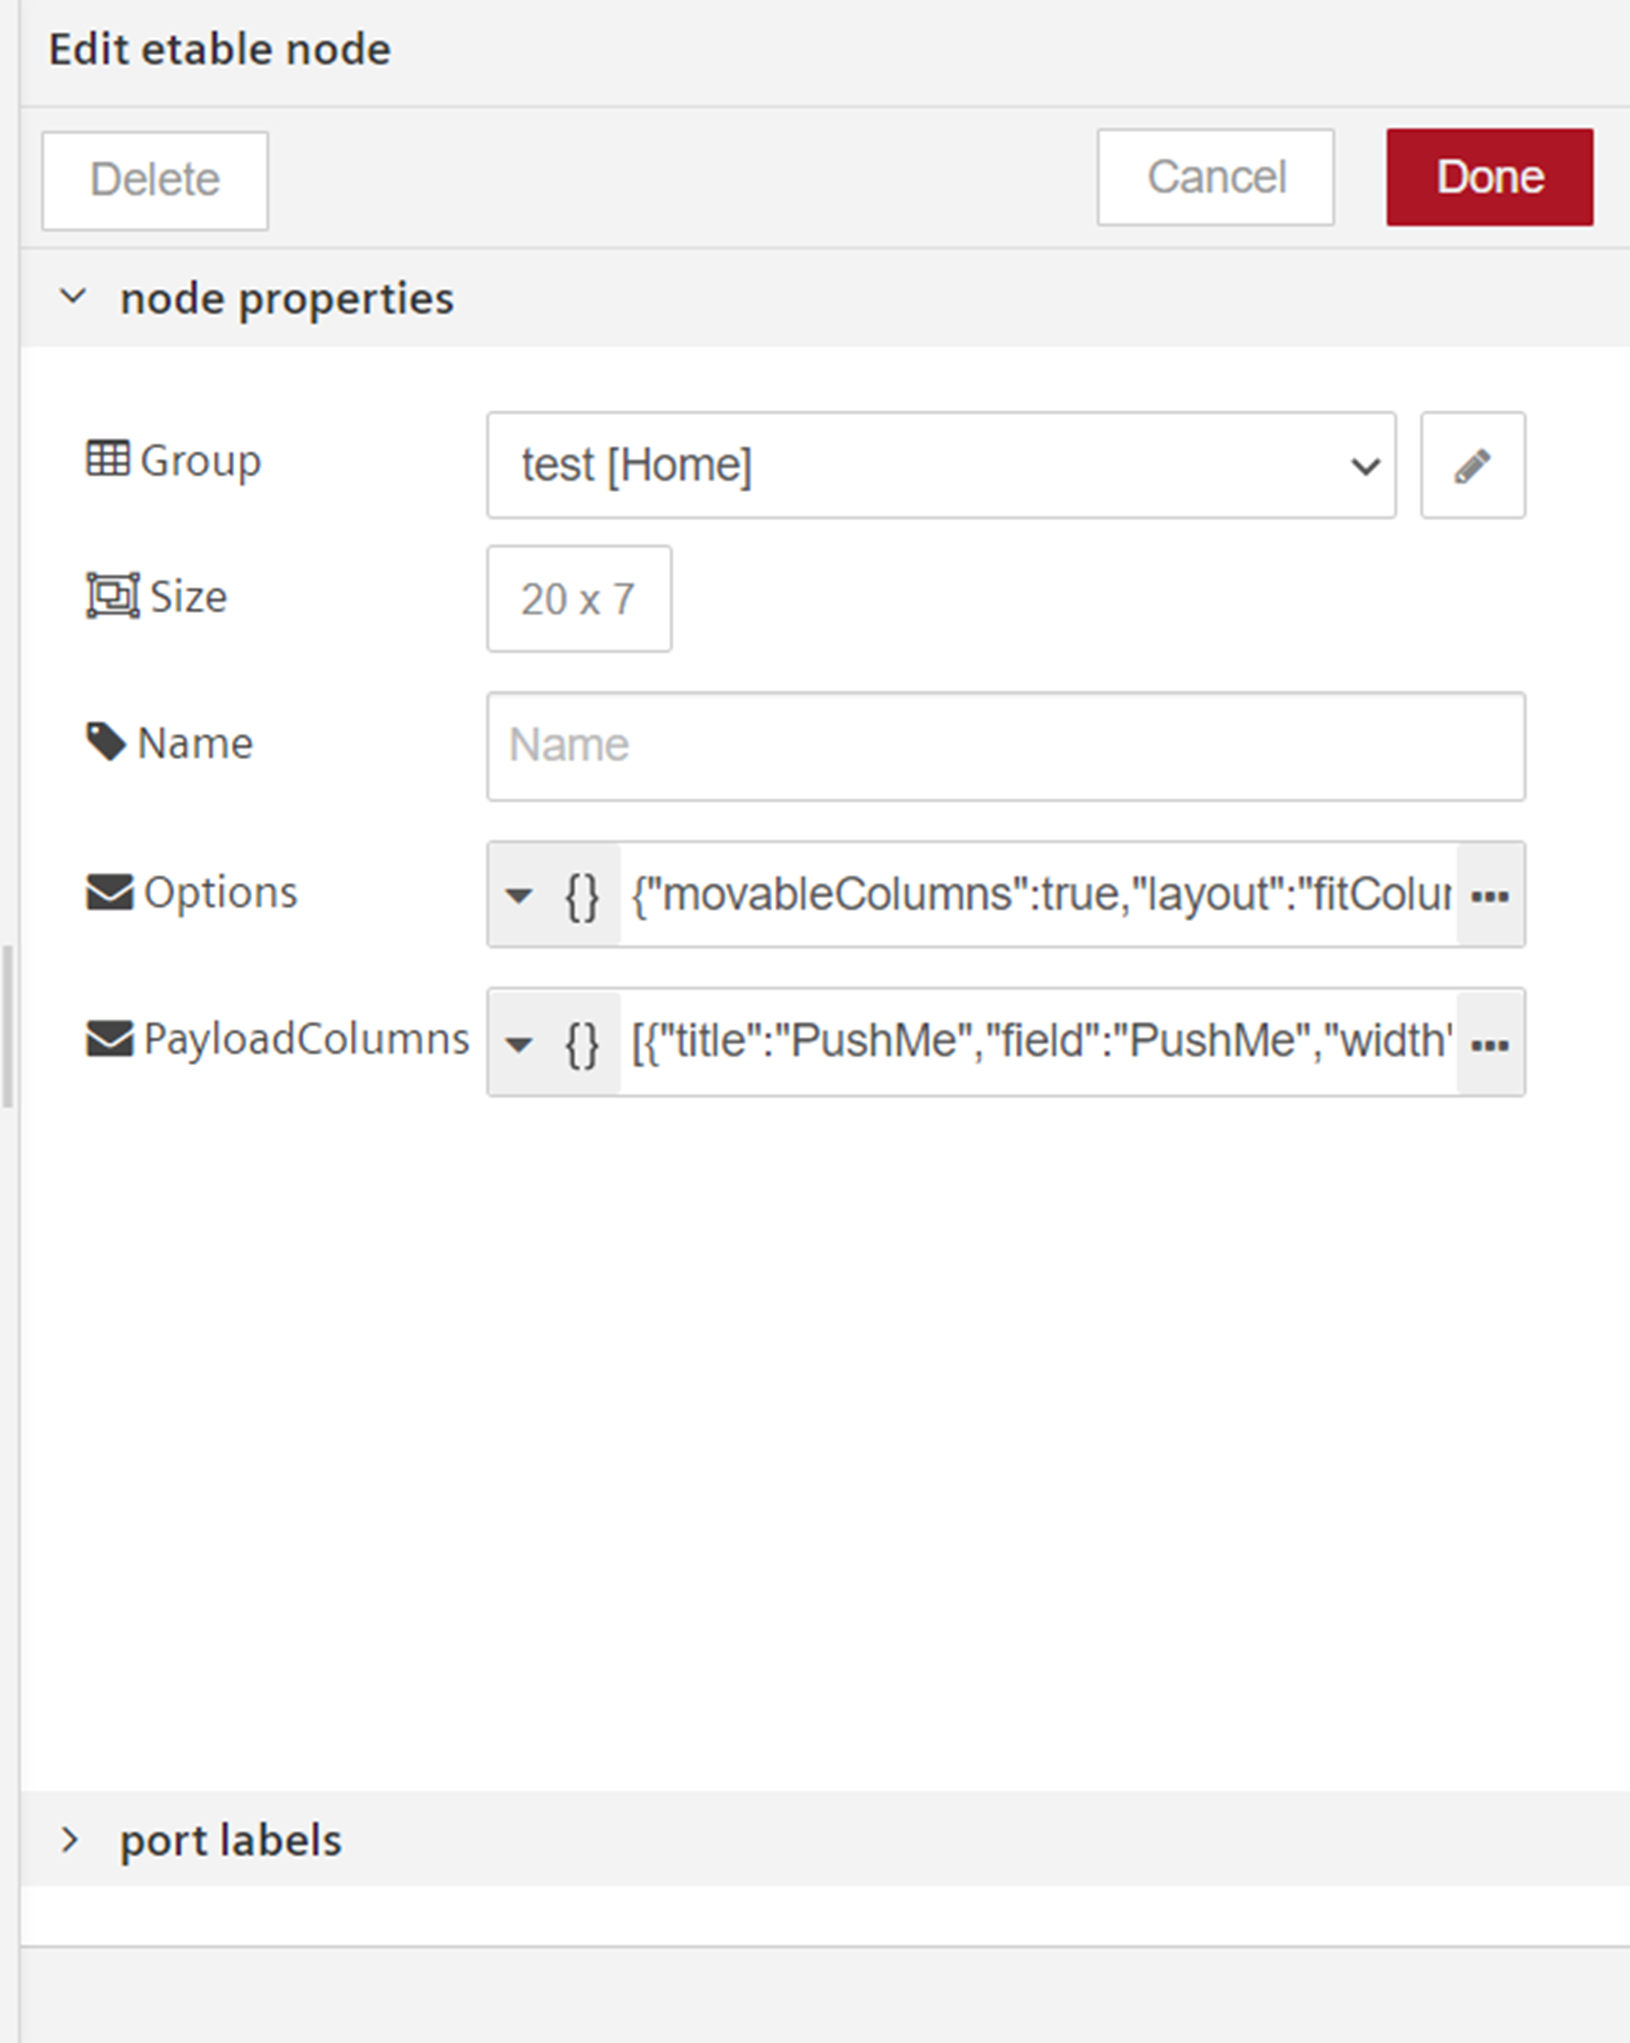
In "etable" node, enter the below json code in the "Options" field. - Options:
    {
        "movableColumns": true,
        "movableRows": true,
        "layout": "fitColumns",
        "pagination": "local",
        "height": "700px"
    }
In "etable" node, enter the below json code in the "PayloadColumns" field. - PayloadColumns:
[ { "title": "AssetType", "field": "AssetType", "width": "10%", "editor": false }, { "title": "AssetProgress", "field": "progress", "formatter": "progress", "sorter": "number" }, { "title": "Date Of Manufacture", "field": "dom", "sorter": "date", "hozAlign": "center", "width": "30%", "editor": false }, { "title": "Rating", "field": "rating", "formatter": "star", "hozAlign": "center", "width": "30%", "editor": true } ] -
Save and execute the flow.
Output in the dashboard window
Open Visual Flow Creator dashboard to view the output.
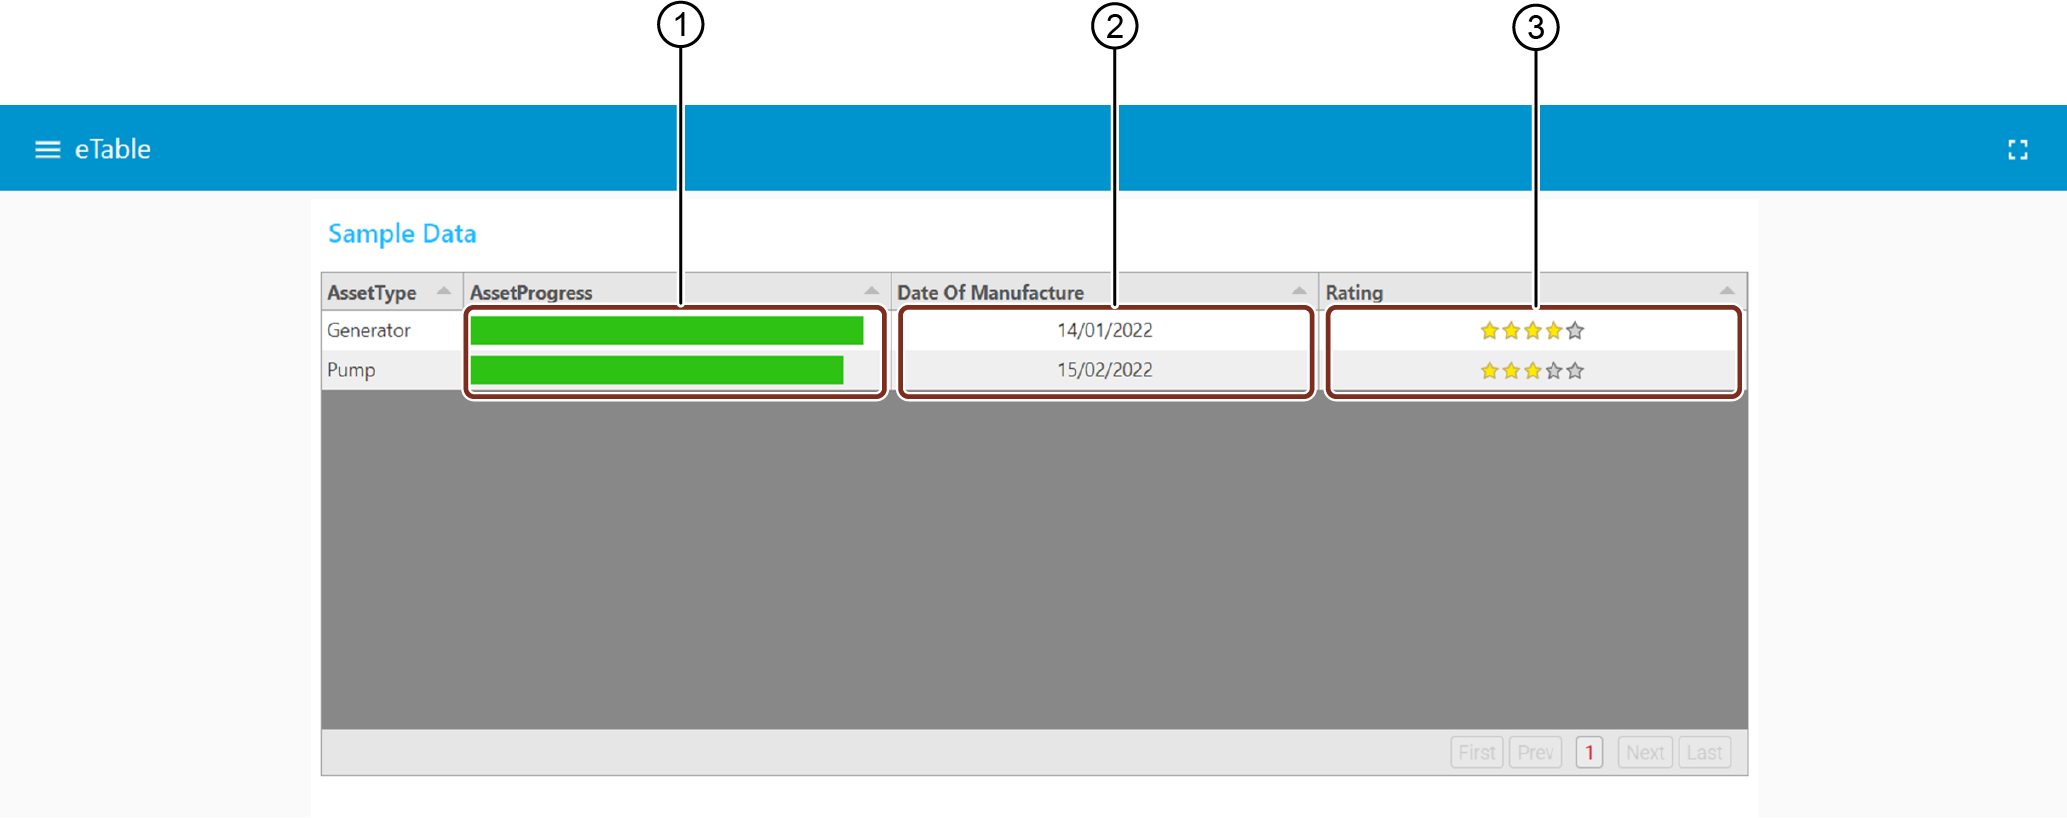
① Allows editing or updating the asset progress
② Allows editing or updating the manufacturing date of the asset
③ Allows editing or updating the rating of the Asset
You can edit or update the etable data on Visual Flow Creator dashboard directly.