Usage Metrics in Predictive Learning
The Usage Metrics page shows the number of compute hours that remain for your organization and also lists your individual transactions and the number of compute hours you have used.
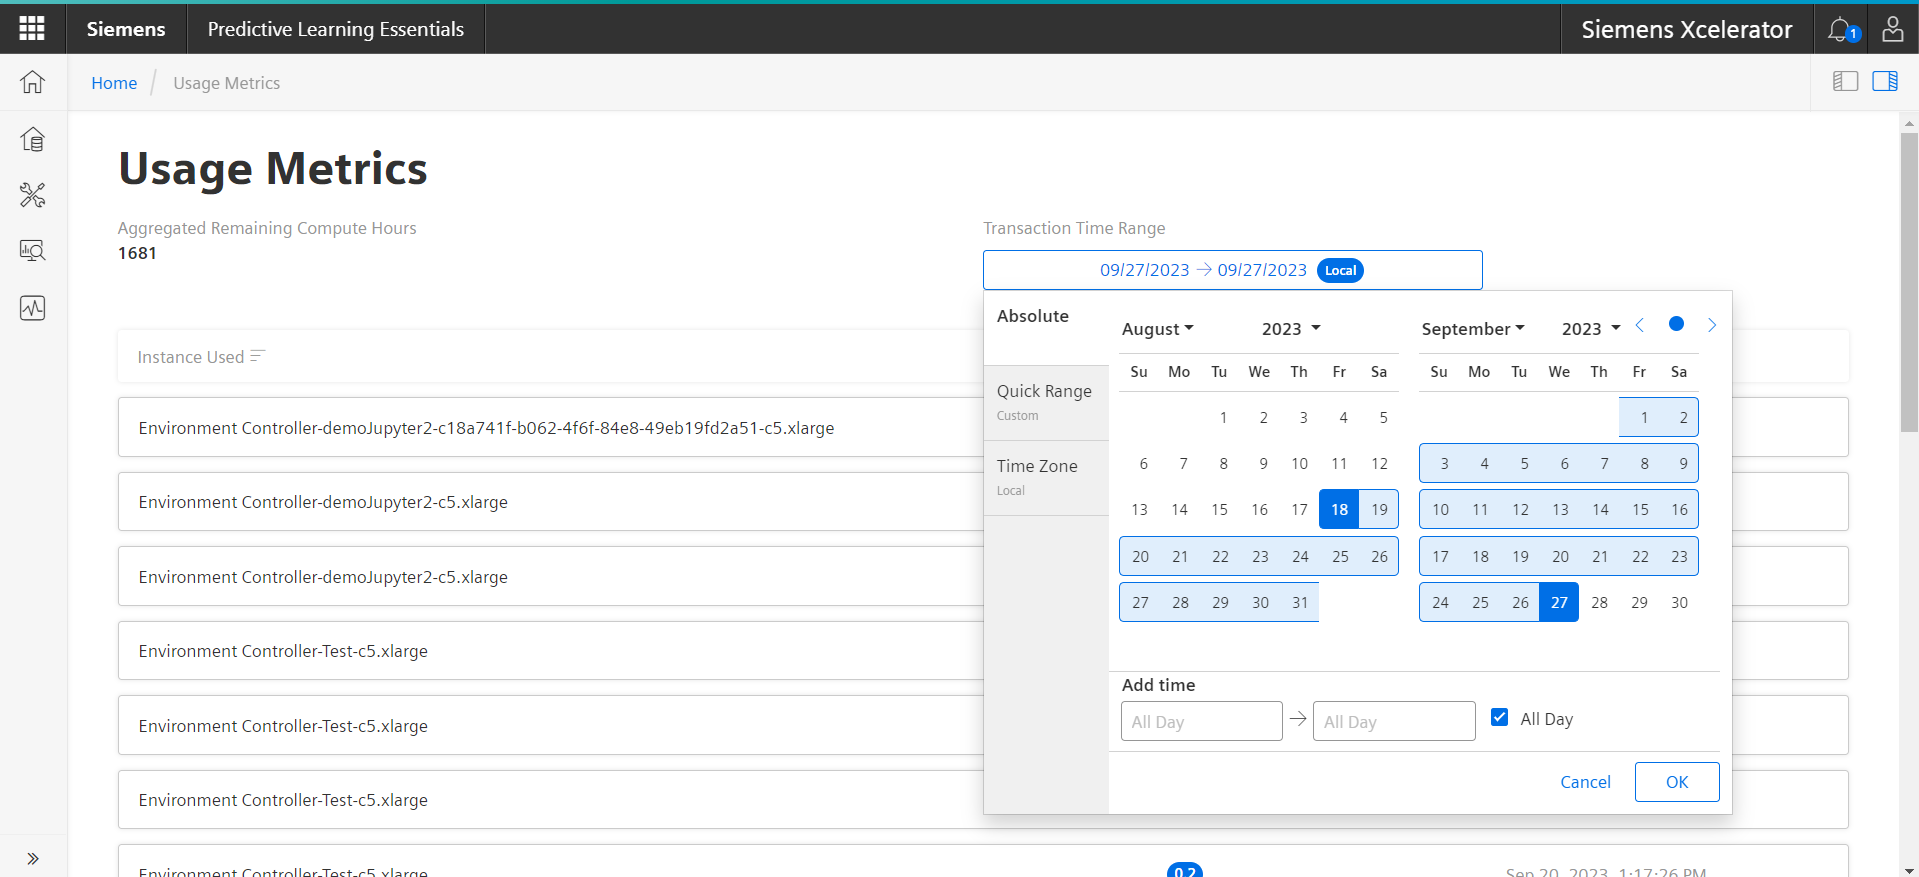
Usage transaction Time Range
Here is an example of the the calendar display that opens when you click the calendar icon. Click a starting date and an ending date/time for the environment instances you want to display in the Usage Metrics table:
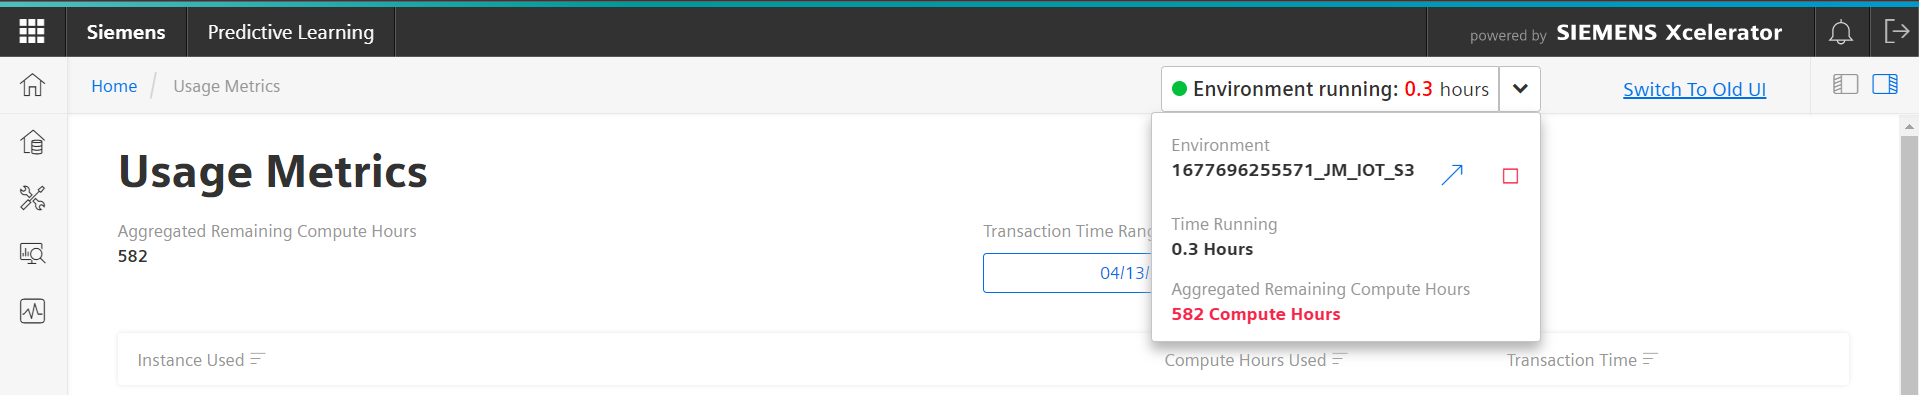
Environment Hours Left
Click the drop-down arrow in the "Environment Hours Left" field to see additional details about compute hours remaining and time left for a selected environment. You can also start and stop an environment using the "Start/Stop Environment" toggle in the Environment details drop-down list.
Here is an example of the Environment Hours Left" drop-down display:
Compute hours
"Together with the application you get an amount of a consumption metric named compute-hours. During development and job execution or job scheduling the system consumes these hours based on the load and complexity of the used environments. The accumulated load values will be subtracted from the pool of compute-hours. Additional capacities can be bought using the store."
Except where otherwise noted, content on this site is licensed under the Development License Agreement.