Evaluate the Productive Prediction results
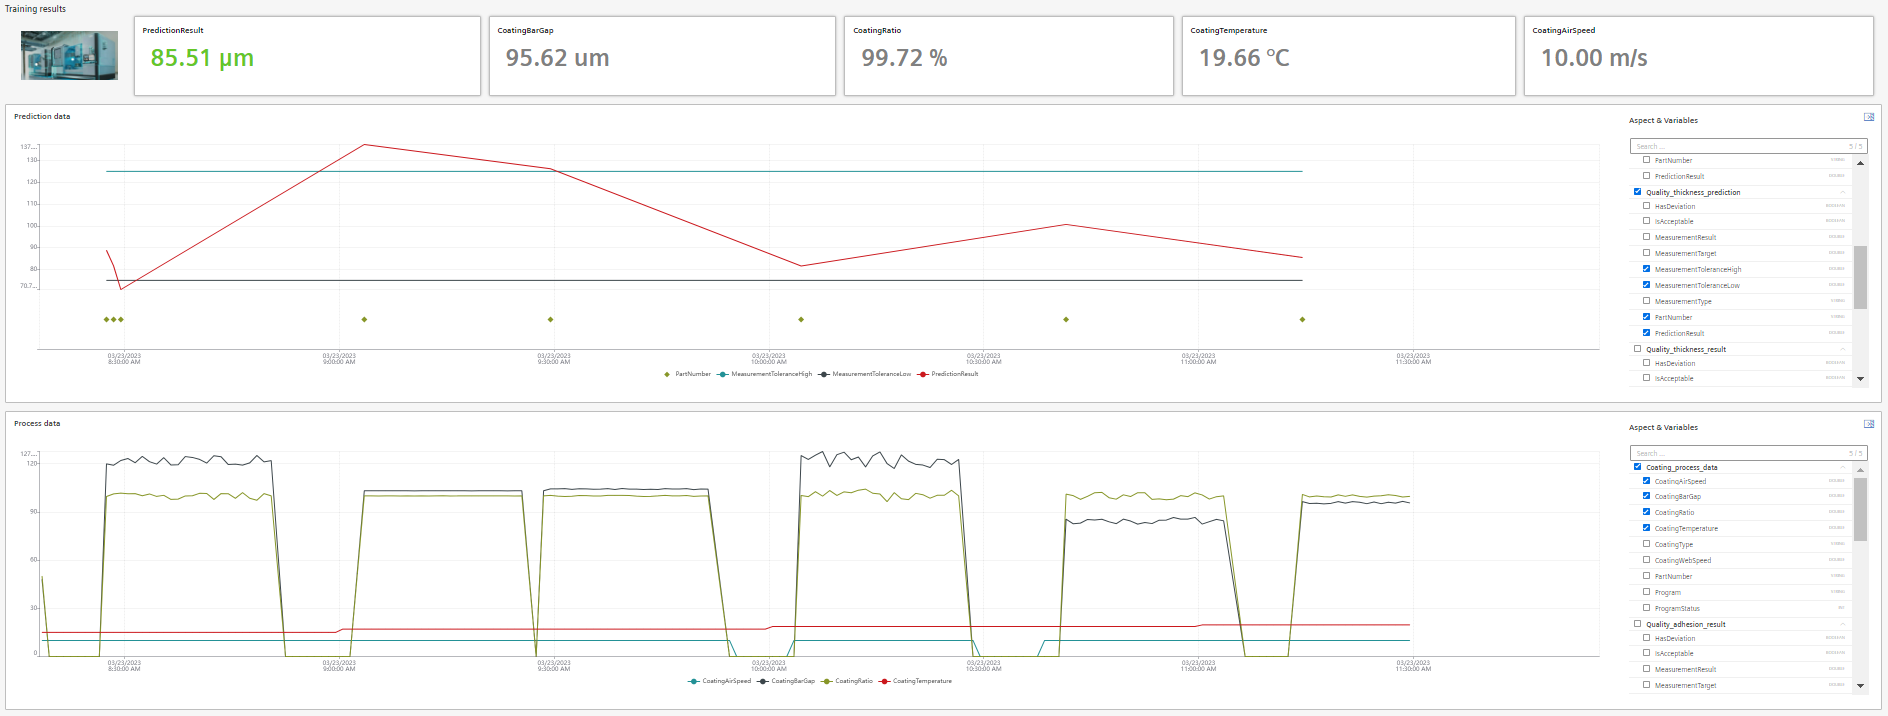
The Operator Board displays the timeseries chart of the prediction quality result compared with the tolerance limits and synchronized chart of the process parameters. The process and quality prediction variables defined in the model configuration is selected and displayed on the dashboard.
“Operator Board” is accessible from the model versions overview. Operator Board evaluates current production parameters in the context of predicted quality results.
Further variables are selected from the corresponding process and quality aspects by selecting the parameters.
Current prediction result and current values of the process parameters are displayed automatically as indicators on top of the page. The prediction result value indicated is in green, if the result stays within the tolerance limit or red, if the value is beyond the tolerance limit during the production phase of the manufacturing process.
The predicted value is displayed as “N/A” if the process is in the non-productive phase.