Frequency spectra
Frequency Spectra extension allows you to visualize the signal data based on frequency in order to analyze the possible cause impacting the machine downtime. The "Frequency Spectra" extension supports the datatypes which have been defined for this asset type for the visualization of the frequency signals.
The analysis package "Frequency Spectra" extension analyzes the frequency signals by calculating selected spectral quantities (Fast Fourier Transformation) such as frequency-based acceleration, acceleration envelope and velocity spectra. These quantities can be used to evaluate the spectral composition of the given input signal considering a fixed frequency range (speed independent) and allows an early detection of mechanical fault of rotating equipment. The service engineers can compare this frequency graph with the reference graphs to predict the possible fault resulting in the possible machine downtime.
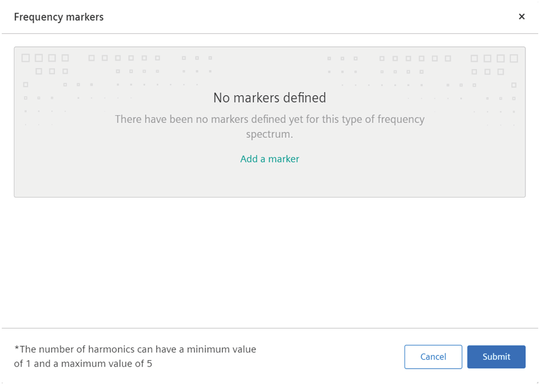
Frequency Markers
While visualizing the frequency data, if you identify any critical frequency, add a marker for future reference. This Frequency markers allows the user to compare the current spectrum with pre-configured critical frequencies and their harmonics. This comparison further helps the engineers in performing the basic analysis.
To add a Frequency marker, proceed with the following steps:
- In the Frequency spectrum extension, select the file and click "Create a Marker".
- In the frequency marker page, click Add a marker.
- Enter the Name, Frequency and Number of harmonics.
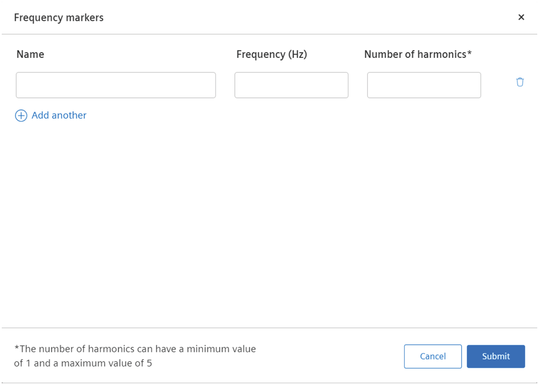
Note
- Number of harmonics refer to the number of times the markers repeat as per the defined frequency.
- Maximum number of harmonics is limited to 5.
Visualizing Frequency Signal data
To visualize the frequency data, proceed as follows:
- In the "Frequency spectra" extension, select the required date and time range.
- Click "Apply".
-
Select the spectrum from the "Files" list.
The graph of the selected frequency is displayed.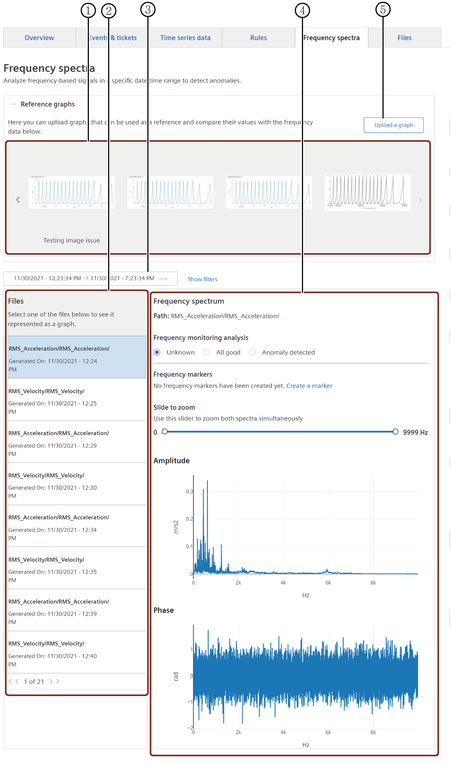
① Reference graphs: To compare and predict the cause of failure
② List of available spectra files
③ Timepicker: Selection and specification of the time zone and the time period of the visualization
④ Data visualization area
⑤ Uploads the reference graph
-
Add the Frequency marker for comparing the signal data.
- Compare the frequency data with the available reference graphs and the frequency markers to detect the possible faults in the asset.