Navigating Dashboard Designer
A number of Dashboard Designer features are accessible directly from the top two rows of the user interface (UI). The major features -- queries and visualization are described below, as well as the icons that lead to other features.
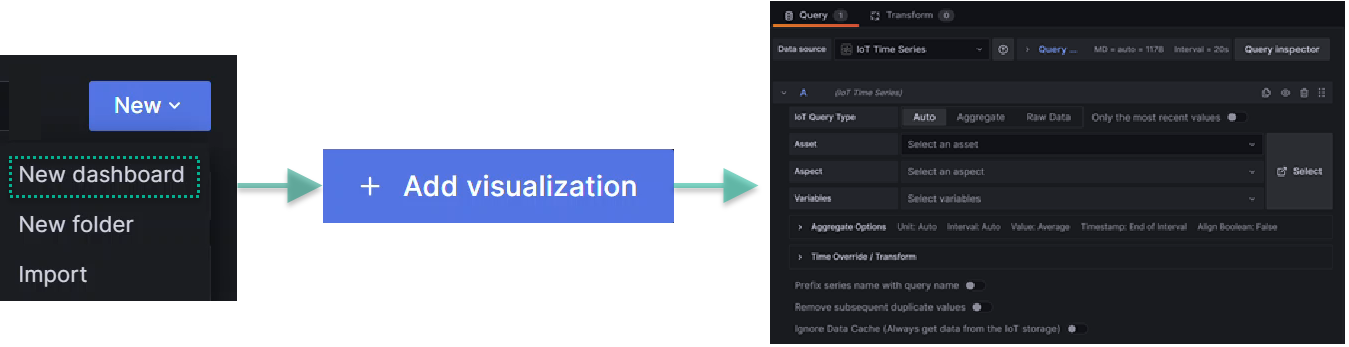
Adding a Data source
You have to add a data source before you can build a query or create a visualization for a dashbaord. This image shows the two clicks that take you to the query editor with your selected data source (in this example, IoT time series) ready for you to use in a query.
Query Panel
Here's a larger version of the query editor:
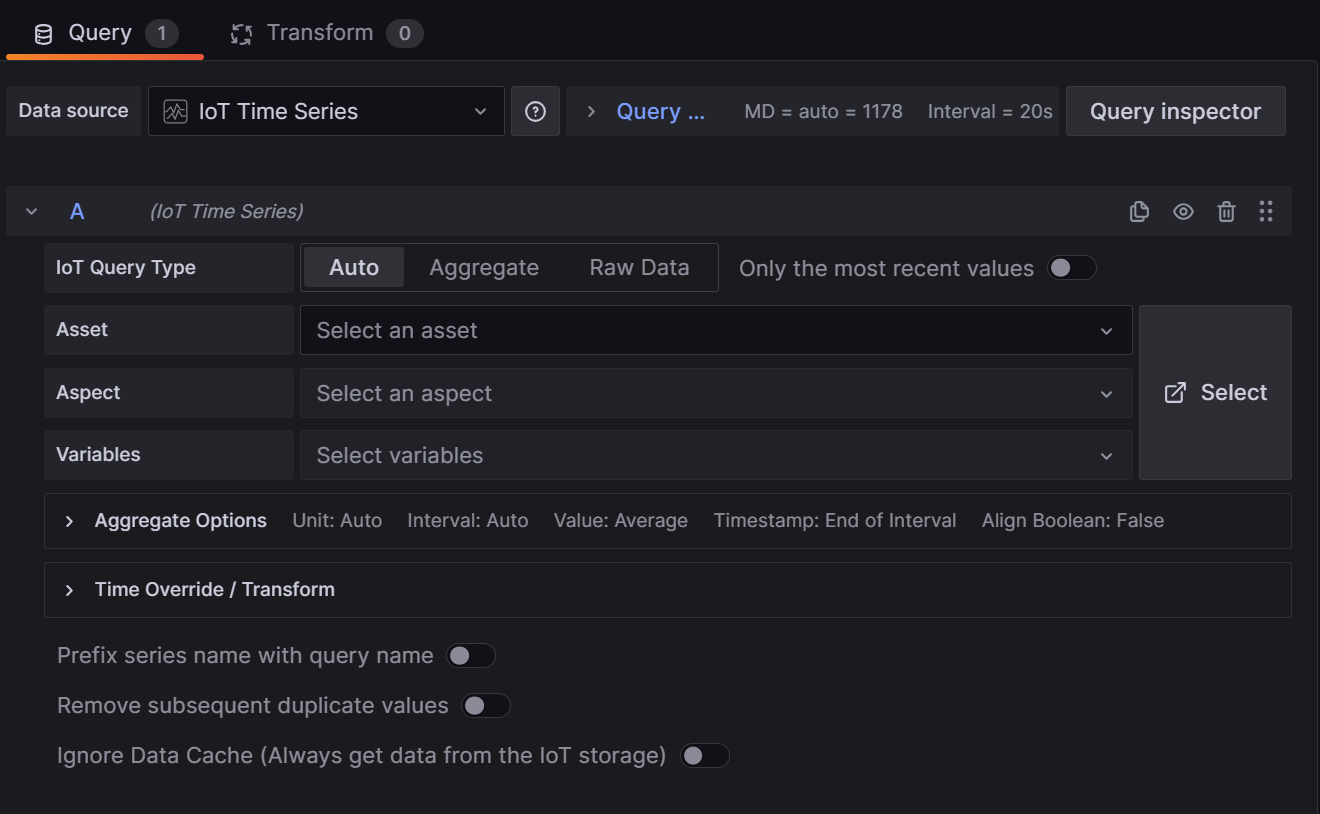
For more information on using the query editor, see the Creating Dashboards topic.
When you finish configuring your query, you can customize your visualization.
Visualization Panel
Here's an example of the visualization panel fields (shown collapsed):
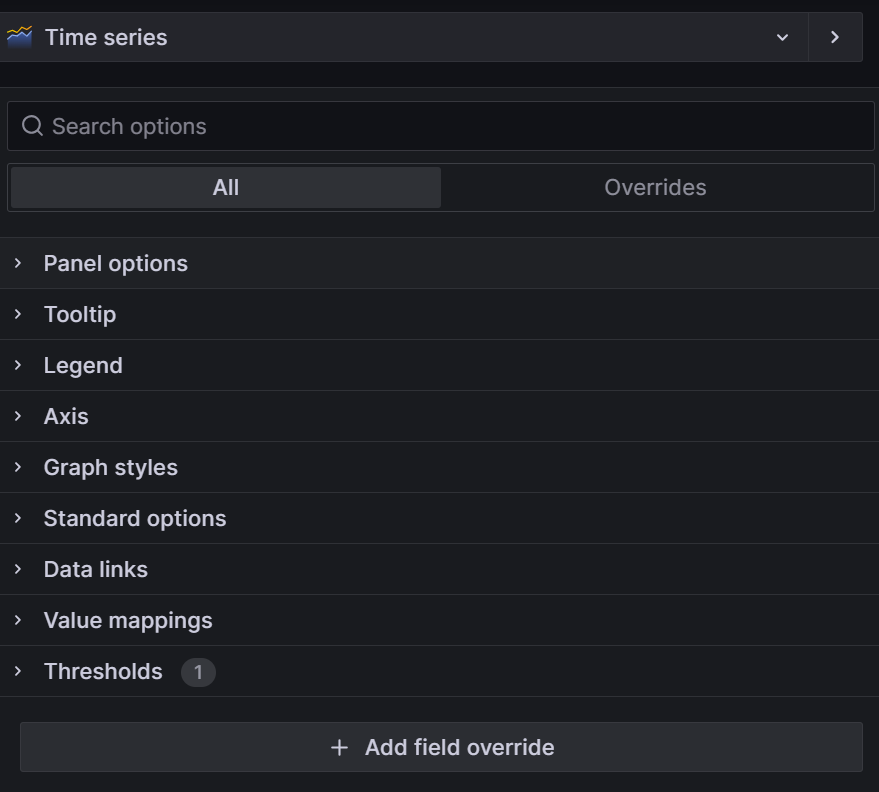
For more information on using the visualization panel, see the Creating Dashboards topic.
Icons and Features
When you open Dashboard Designer, icons along the top of the user interface (UI) connect to various features. This table describes the icons and features in the order they appear on the landing page, left to right.
| Location | Feature or Icon | Description |
|---|---|---|
| Landing page | What's new & next | Displays news and information about Dashboard Designer development |
| Home menu | Starred | Signifies favorite items that you can click to navigate to |
| Home menu | Dashboards | Click to open the folders and files where your dashboards are stored |
| Primary row | Explore | Explore data and try out various queries and graph settings with the option of creating a dashboard from your exploration |
| Primary row | Settings | Displays settings for the open dashboard |
| Primary row | General | Displays general information for the open dashboard |
| Primary row | Annotations | Displays annotations for the open dashboard |
| Primary row | Variables | Displays variables for the open dashboard |
| Primary row | Asterisk icon | Click to view keyboard shortcuts |
| Primary row | Links | Displays links for the open dashboard |
| Primary row | Versions | Displays version information for the open dashboard |
| Primary row | Permissions | Displays permission settings for the open dashboard |
| Primary row | Refresh icon | Click to update the data or to select the rate at which to refresh dashboard data |
| Primary row | Collapse icon | Closes and opens the secondary menu row |
| Primary row | Time range | Displays the time range of the open dashboard |
| Secondary row | Landing page icon | Click any time, anywhere to return to the landing page |
| Secondary row | Search | Enter search terms and click to jump to a feature |
| Secondary row | Jump | Click to jump to recently accessed actions, dashboards, pages, preferences |
| Secondary row | Asterisk icon | Click to create a new dashboard or import one |
| Secondary row | Question mark icon | Links to documentation, support, community, open source resources, and keyboard shortcuts |
| Secondary row | Tenant icon | opens your user profile and notification history |
Note
Dashboard Designer does not support the Connections feature.
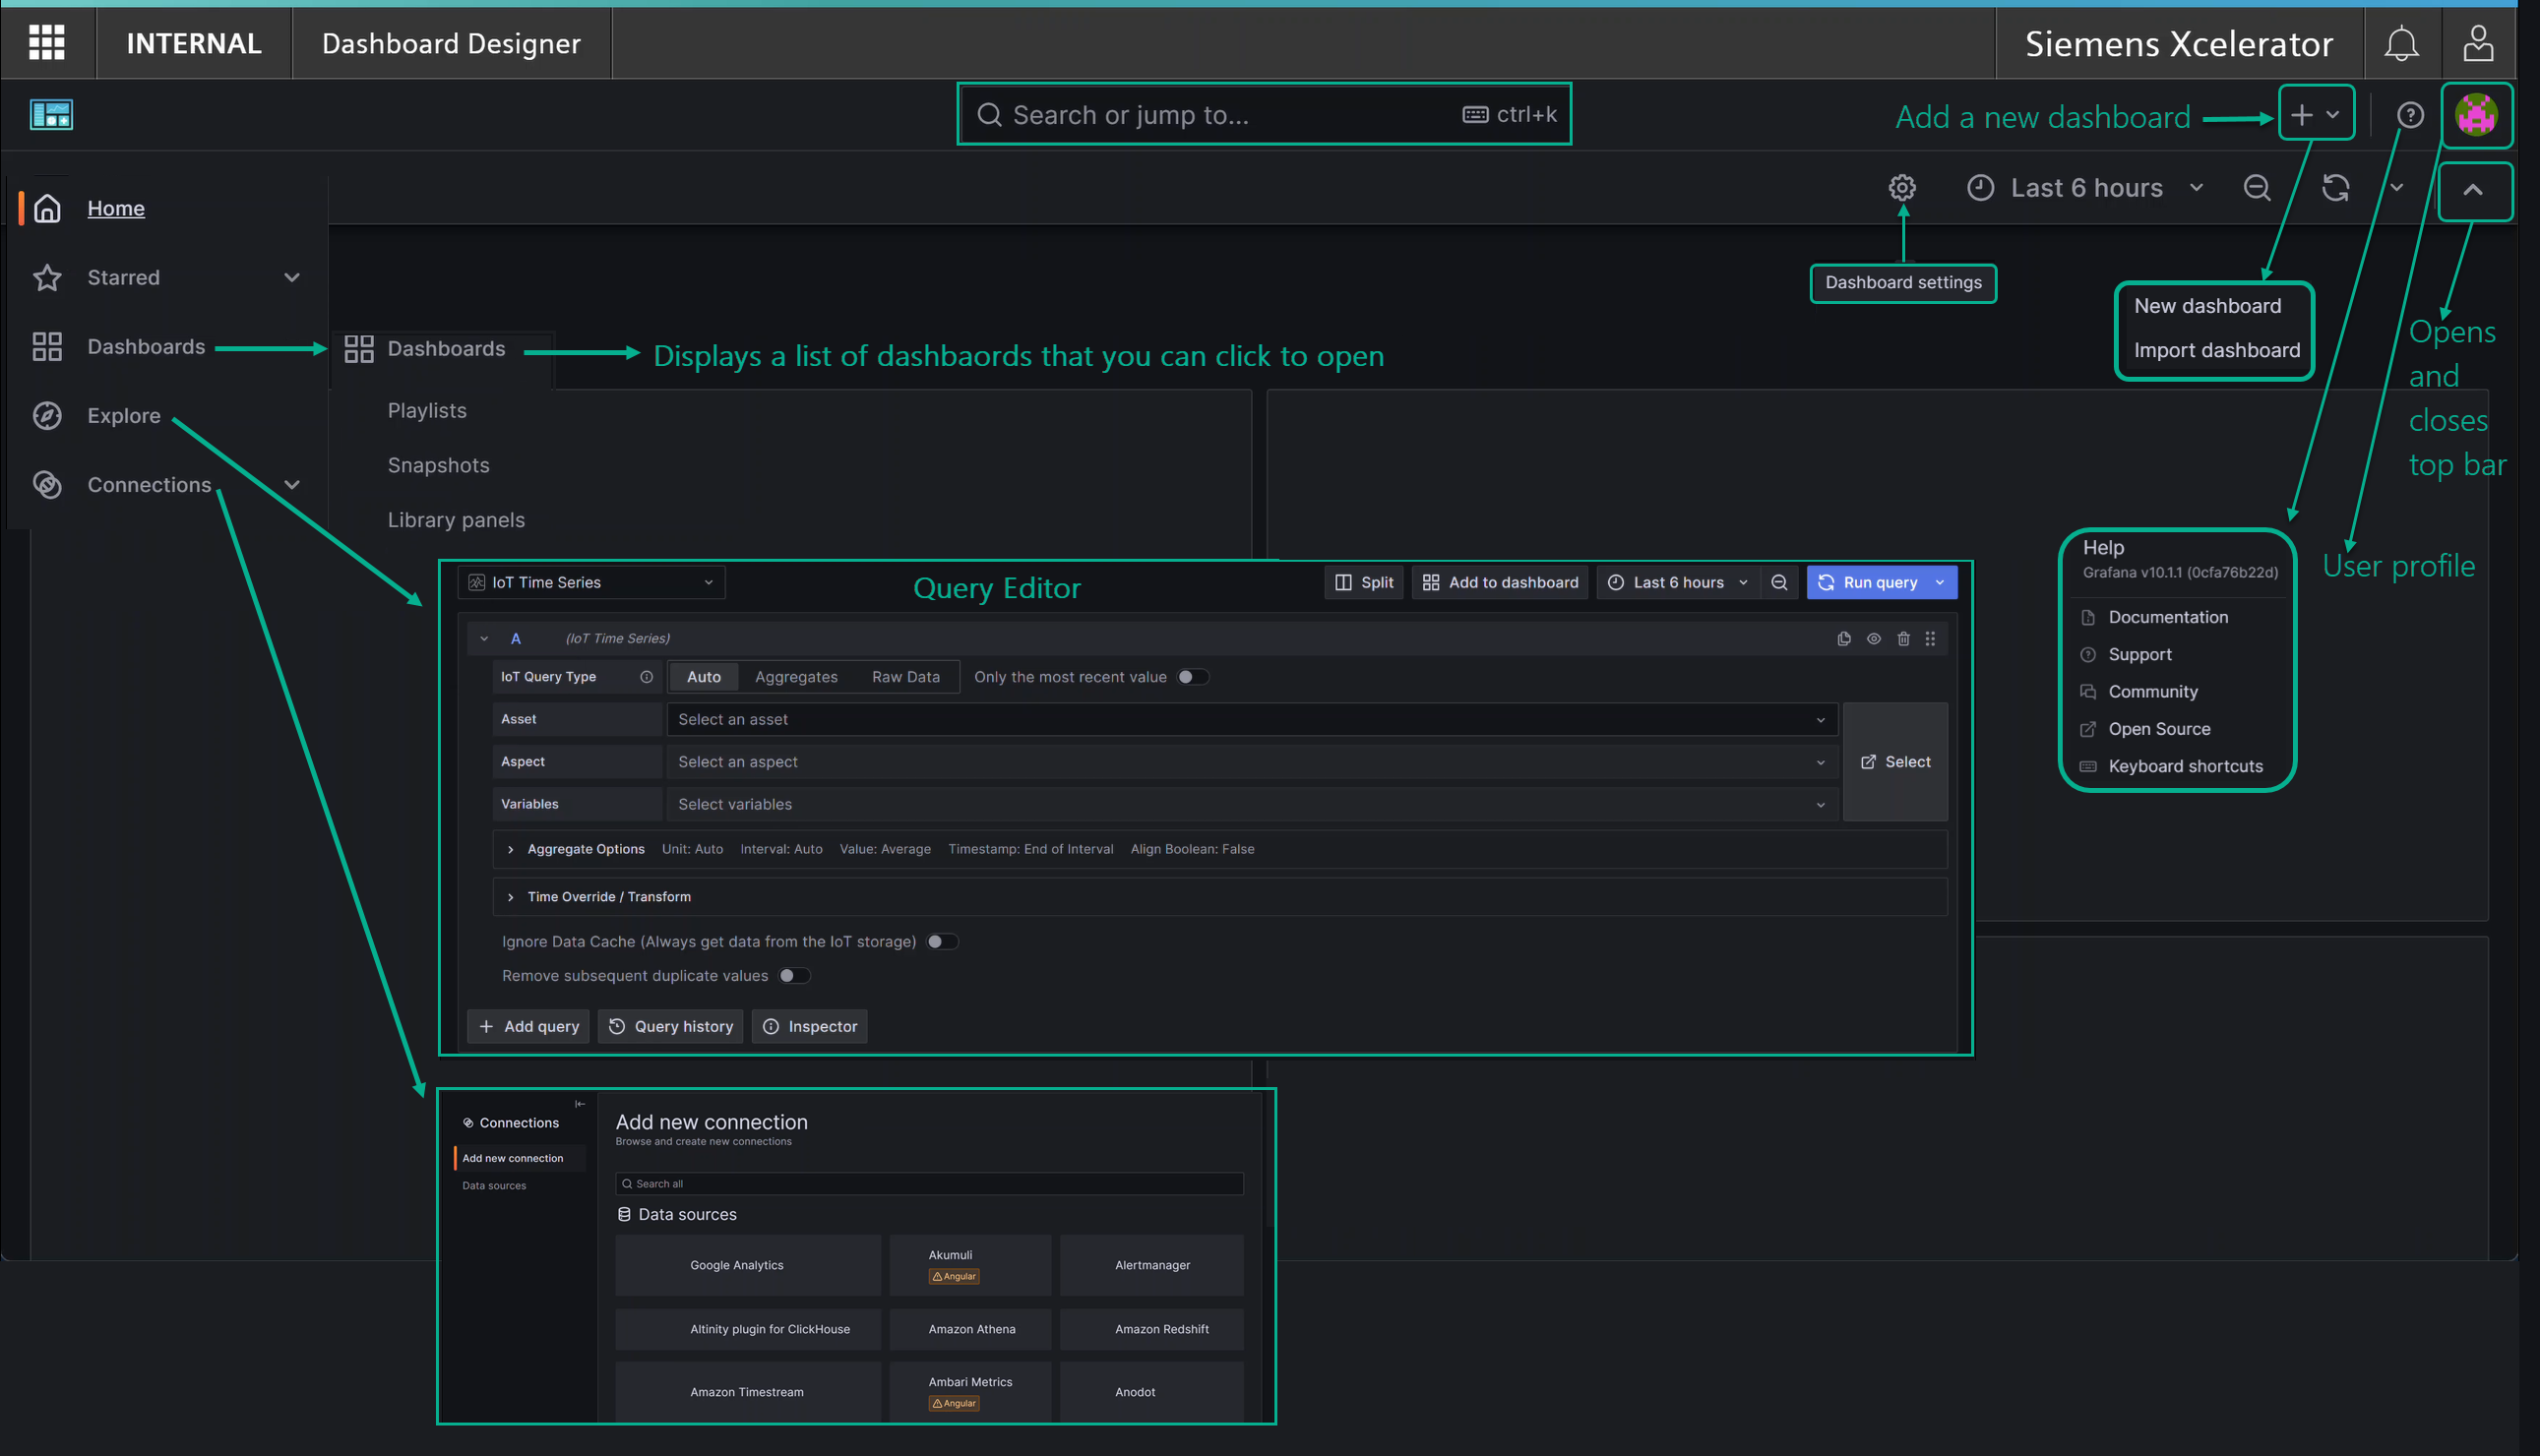
Landing Page
Here is an image of the Dashboard Designer landing page, with pointers for locating various features. The section below describes the features you can access from the landing page.
Exploring Data without Creating a Dashboard
From the Home menu, select 'Explore'. A query panel opens in which you can select your data source, apply configuration options, and run the query. As you adjust panel serrings, the graph reflects your changes. You can also switch between lines, bars, points, etc. on the graph. When you like what you see, click the 'Add to dashboard' button to turn your exploration into a dashboard panel.
Note
To explore data, you must first add the data source. See the Creating Dashboards topic for details.
User profiles
Your user profile opens when you click the icon indicated in the landing page image, although your icon will differ from the example.
Info
Keyboard Shortcuts: Dashboard Designer has many built-in keyboard shortcuts for general purposes, time range, and panels. You can view them by clicking the ? icon on the primary menu bar.